DESIGN OF A STABLE CHANNEL
ON A STEEP SLOPE USING THE EXPONENT OF THE RATING CURVE
Victor M. Ponce 1 and
Vassiliki Boulomytis
2
1 San Diego State University, San Diego,
California, USA
2 Instituto Federal de São Paulo, Campus Caraguatuba, São Paulo, Brazil
[210508]
ABSTRACT.
The design of a stable channel to be hydraulically stable is governed
by the well-known Vedernikov criterion. However, it can be shown that
channel stability depends on the shape of the cross section, whether it is trapezoidal,
rectangular, or triangular. For a given section, there is a unique
relationship between the exponent β of the rating curve Q - A (flow rate
vs flow area) and the value of V/F, in which V =
Vedernikov number,
and F = Froude number.
In this article we use the online
calculator15b, which
calculates the value of β and the corresponding
Vedernikov number for a rectangular, trapezoidal, or triangular
cross section. Three series of tests are carried out for a hypothetical steep channel,
keeping constant the flow rate Q, Manning friction coefficient n, and
the bottom slope S, while varying the value of the
side slope z: (a) 0.25; (b) 0.5, and (c) 1.0. It is concluded
that by judiciously reducing the bottom width b, the Vedernikov number V decreases
more quickly to values less than 1 for the smallest values of the side slope z
in the range 0.25 ≤ z < 1.
|
1. INTRODUCTION
The design of a lined canal on a steep slope to be hydraulically stable
is governed by the well-known Vedernikov criterion
(Ponce, 2014).
However, it can be shown that this depends on the shape of the cross
section, whether it is trapezoidal, rectangular, or triangular.
For a given section, there is a unique relationship between
the exponent β of the rating curve
(the discharge Q vs flow area A relation)
and the value of V/F,
in which V = Vedernikov number, and F
= Froude number.
Herein, we use the online calculator calculator15b, which
calculates
the value of β for a trapezoidal, rectangular,
or triangular cross section. Unstable flow theory
indicates that stability is achieved for
values of β greater
than but close to 1. At the lower limit, for β = 1,
the section is inherently stable, that is, stable
for any value of the Froude number
(Ponce and Porras, 1995).
We calculate the value of β for a series of sections,
keeping constant the flow rate Q, friction coefficient n, and bottom slope S,
and varying the side slope z (z H: 1 V)
and, therefore, the flow depth y. The calculator determines the
Froude F and Vedernikov V
numbers, and the associated
value of β. The optimal design section is that
which corresponds to the lowest value of β compatible
with the planned cost of the project. This cost is
a function of the depth of excavation that is required to ensure
that the flow remains stable, that is, to assure that V < 1.
2. THEORY
The theory of hydrodynamic stability of open-channel flow
is due to Vedernikov, who introduced the concept
of the number bearing his name (Vedernikov, 1945; Powell, 1948).
According to this theory, the Vedernikov number is the
relationship between the relative speed of the kinematic
wave and the relative speed of the dynamic wave (Ponce, 1991).
For V < 1, the flow is stable; for
V > 1 the flow
is unstable. This latter condition is frequently associated with the occurrence of
roll waves (Fig. 1).
Fig. 1 Roll waves observed in a canal
in the Swiss Alps
at the turn of the 20th century
(Cornish, 1907). |
In certain cases, the roll waves may be of
such magnitude to threaten life and property, as shown by the recent experience
in channeled rivers built in La Paz, Bolivia in the past two to three
decades (Fig. 2)
(Ponce and Choque Guzman, 2019). Therefore, it is imperative
to design canals to avoid or reduce the
incidence of roll waves. As shown here, this may
be achieved by designing the shape of the cross section
to reduce the value of β so that
the Vedernikov number remains less than the threshold value V = 1.
[Click on top of the figure to watch the video]
Fig. 2 Occurrence of roll waves in the
channelized section of the Huayñajahuira river,
La Paz, Bolivia, on February 24, 2016.
|
3. RELATIONSHIP BETWEEN β AND V/F
Ponce (2014) has determined
the relation between the exponent β of the rating curve
(Q = α Aβ ) and the value of V/F:
For V = 1, the neutrally stable Froude number Fns is:
Table 1 shows corresponding values of β and Fns for three
types of cross-sectional shape and two types of friction.
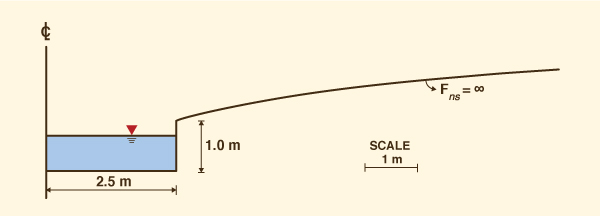
Figure 3 shows the shape of the inherently stable channel
(Ponce and Porras, 1995).
Table 1. Values of β and Fns
corresponding to
three typical cross-sectional shapes.
|
| Cross-sectional shape |
Friction |
β |
Fns |
| Hydraulically wide |
Manning |
5/3 |
3/2 |
| Chezy |
3/2 |
2 |
| Triangular |
Manning |
4/3 |
3 |
| Chezy |
5/4 |
4 |
| Inherently stable |
Manning or Chezy |
1 |
∞ |
Fig. 3 Shape of an inherently stable channel. |
4. ONLINE CALCULATOR
The online calculator onlinechannel15b
calculates the value of β, the exponent of the rating curve, corresponding to
a rectangular, trapezoidal, or triangular cross-sectional shape.
Input data is the following:
Bottom width b
Flow depth y
Side slope z1
Side slope z2
Manning's n
Bottom slope S
Output results are the following:
Wetted perimeter P
Top width T
Flow area A
Hydraulic radius R [R = A / P ]
Hydraulic depth D [D = A / T ]
Discharge Q
Flow velocity v [v = Q / A ]
Froude number F [F = v /(gD1/2)]
Rating exponent β [Eq. 1]
Neutrally stable Froude number Fns [Eq. 2]
Vedernikov number V [V = (β - 1) F ]
The results are obtained by the
trial and error described here.
Given the selected (constant) input values of z1, z2, n and S,
the chosen design discharge Q is obtained by trial and error
using the calculator. The procedure consists of
varying the bottom width b of the trapezoidal channel,
within an appropriate range, to determine the value of flow depth y that exactly matches the chosen design
discharge Q.
Output results consist of v, F,
β, Fns and V.
The results are analyzed, including project cost considerations,
to estimate the design bottom width b
that best satisfies the Vedernikov stability criterion: V ≤ 1.
5. THE UNSTABLE CHANNEL
A hypothetical example of an unstable channel is presented herein.
Assume a channel of rectangular cross-section,
of width b = 6 m. The design discharge is
Q = 100 m3/s,
the Manning coefficient is n = 0.025 (masonry-lined channel),
and the bottom slope is S = 0.06.
These data approximately simulate
the conditions in the Huay�ajahuira and Achumani channelized
rivers of (the city of) La Paz, Bolivia (Figs. 4 and 5). In these channels,
the occurrence of roll wave events has been documented with some regularity in the past several years
(Ponce and Choque Guzman, 2019).
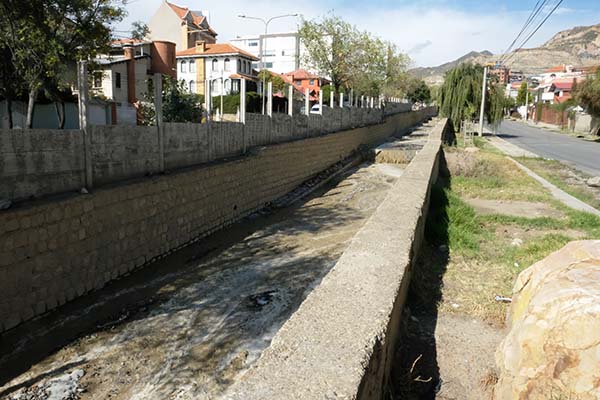
Fig. 4 The channelized Huayñajahuira river,
La Paz, Bolivia. |
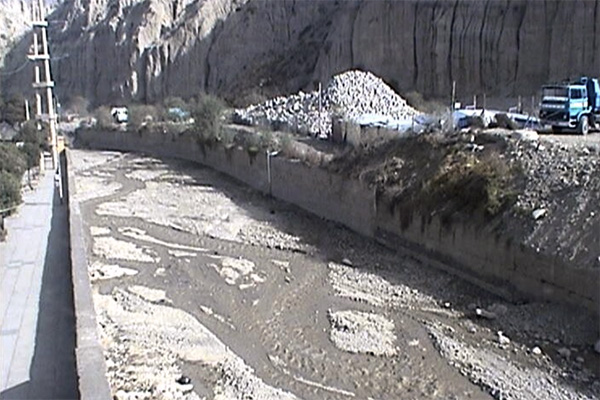
Fig. 5 The channelized Achumani river, La Paz, Bolivia. |
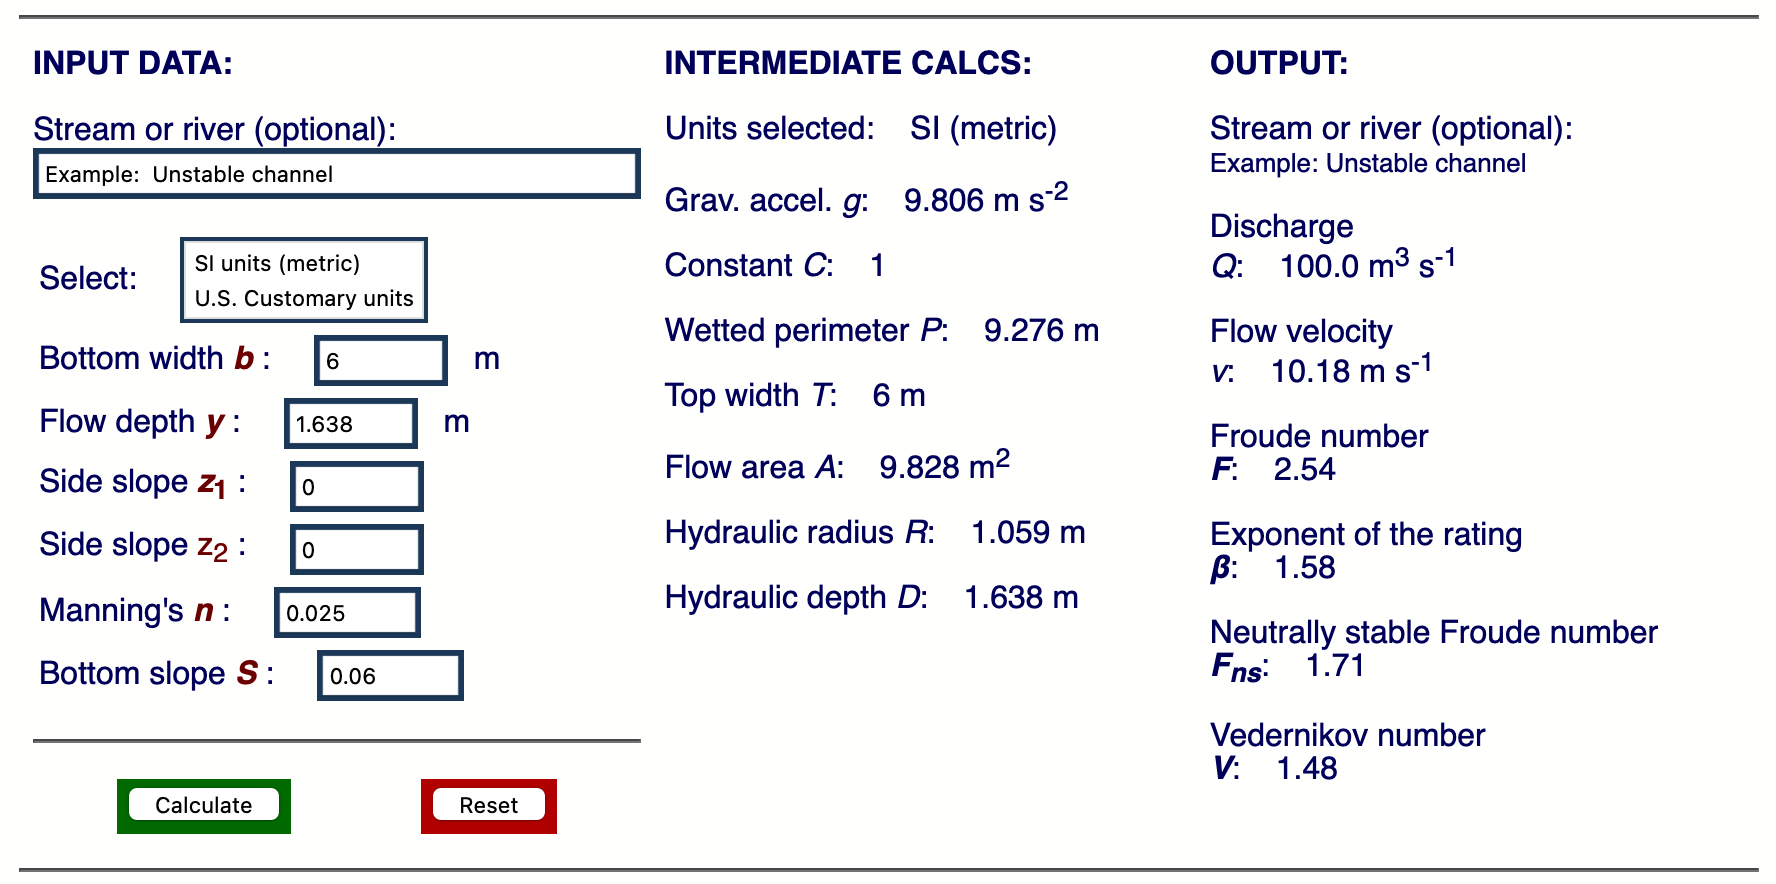
Figure 6 shows the output of
onlinechannel15b. For the given flow conditions,
the calculated Vedernikov number is:
V = 1.48; that is, the flow is unstable.
Fig. 6 Calculations for the case of unstable flow in a steep channel. |
6. TESTING PROGRAM
The objective of the testing program is to determine the
hydraulic conditions in a series of alternative channel sections
for which the Vedernikov number covers the range V ≷ 1.
This is obtained by specifying a trapezoidal cross-section
(z > 0) and varying the bottom width b within a suitable range.
The testing program considers the following three series of trapezoidal cross-sections:
z = 0.25;
z = 0.5; and
z = 1.0.
The results of the calculation are shown in Tables 2 to 4.
It is concluded that when reducing the bottom width b
in the range 5 ≥ b ≥ 1, the Vedernikov number V
decreases
more quickly to values less than 1 for the smallest values
of the side slope z in the range 0.25 ≤ z ≤ 1.
We note that the lowest value of V
(V = 0.55)
is obtained for the case of z = 0.25 and b = 1 (Table 2).
|
Table 2. Results for Series A (z = 0.25).
|
| Q = 100 m3/s |
n = 0.025 |
S = 0.06 |
| Variable |
Bottom width b (m) |
5 |
4 |
3 |
2 |
1 |
| Input |
| y |
1.754 |
2.078 |
2.581 |
3.408 |
4.769 |
| Output flow variables |
| P |
8.615 |
8.283 |
8.320 |
9.025 |
10.83 |
| T |
5.877 |
5.039 |
4.290 |
3.704 |
3.384 |
| A |
9.539 |
9.391 |
9.408 |
9.719 |
10.45 |
| R |
1.107 |
1.133 |
1.130 |
1.076 |
0.965 |
| D |
1.623 |
1.863 |
2.192 |
2.624 |
3.089 |
| Results |
| v |
10.48 |
10.65 |
10.63 |
10.29 |
9.569 |
| F |
2.62 |
2.49 |
2.29 |
2.02 |
1.73 |
| β |
1.56 |
1.53 |
1.48 |
1.40 |
1.32 |
| Fns |
1.76 |
1.87 |
2.07 |
2.45 |
3.12 |
| V * |
1.48 |
1.32 |
1.10 |
0.82 |
0.55 |
| * Two stable
values of V were found, shown in bold. |
|
Table 3. Results for Series B (z = 0.5).
|
| Q = 100 m3/s |
n = 0.025 |
S = 0.06 |
| Variable |
Bottom width
b (m) |
5 |
4 |
3 |
2 |
1 |
| Input |
| y |
1.643 |
1.894 |
2.249 |
2.763 |
3.503 |
| Output flow variables |
| P |
8.673 |
8.235 |
8.028 |
8.178 |
8.832 |
| T |
6.643 |
5.894 |
5.249 |
4.763 |
4.503 |
| A |
9.564 |
9.369 |
9.276 |
9.343 |
9.638 |
| R |
1.102 |
1.137 |
1.155 |
1.142 |
1.091 |
| D |
1.439 |
1.589 |
1.767 |
1.961 |
2.140 |
| Results |
| v |
10.45 |
10.67 |
10.78 |
10.70 |
10.38 |
| F |
2.78 |
2.70 |
2.59 |
2.44 |
2.26 |
| β |
1.56 |
1.53 |
1.49 |
1.43 |
1.35 |
| Fns |
1.76 |
1.86 |
2.02 |
2.30 |
2.77 |
| V * |
1.57 |
1.44 |
1.27 |
1.05 |
0.81 |
| * One stable value of V was found,
shown in bold. |
|
Table 4. Results for Series C: (z = 1).
|
| Q = 100 m3/s |
n = 0.025 |
S = 0.06 |
| Variable |
Bottom width b (m) |
5 |
4 |
3 |
2 |
1 |
| Input |
| y |
1.509 |
1.689 |
1.922 |
2.224 |
2.613 |
| Output flow variables |
| P |
9.268 |
8.777 |
8.436 |
8.290 |
8.390 |
| T |
8.018 |
7.378 |
6.844 |
6.448 |
6.226 |
| A |
9.822 |
9.608 |
9.460 |
9.394 |
9.440 |
| R |
1.059 |
1.094 |
1.121 |
1.133 |
1.125 |
| D |
1.225 |
1.302 |
1.382 |
1.456 |
1.516 |
| Results |
| v |
10.18 |
10.40 |
10.57 |
10.64 |
10.59 |
| F |
2.93 |
2.91 |
2.87 |
2.81 |
2.74 |
| β |
1.55 |
1.52 |
1.49 |
1.44 |
1.38 |
| Fns |
1.79 |
1.89 |
2.03 |
2.25 |
2.61 |
| V * |
1.63 |
1.54 |
1.41 |
1.24 |
1.05 |
| * No
stable values of V were found. |
It is noted that the Froude number F is a function of hydraulic depth D,
and not of flow depth y (Section 4).
The examination of Tables 2 to 4
enables the following conclusions:
The smaller the value of z, the larger the value of D and, therefore, the smaller the value of
F.
The values of β decrease sharply as the bottom width b decreases from 5 to 1,
and slightly as the side slope z decreases from 1 to 0.25.
Within the tested range. the lower the value of z, the faster the Vedernikov number falls below 1.
The most stable section, that is, that with the smallest Vedernikov number below 1,
corresponds to the smallest value of b and the smallest value of z, within the tested range.
For a given hydraulic condition, the lower Vedernikov V numbers correspond to the higher neutrally stable Froude numbers Fns and, consequently, to larger hydraulic depths D. The higher the value of D, the lower the value of β (in the range β greater but close to 1), which favors hydrodynamic stability. In the limit,
β = 1 constitutes an inherently stable cross section (Fig. 3),
that is, stable for any value of Froude number F.
7. CONCLUSIONS
The results of this study show that as the bottom width b decreases
within the tested
range 5 ≥ b ≥ 1, with side slope z > 0,
the values of β and V
decrease accordingly.
The reduction in the Vedernikov number depends on the value of the side slope z,
the reduction being faster (with the decrease in bottom width b)
when z is smaller, within the tested range. In other words, the smaller the side slope z (within the tested range 0.25 ≤ z ≤ 1),
the faster the Vedernikov number falls below 1, enhancing hydrodynamic stability.
Therefore, it is concluded that the value of b that reduces the Vedernikov number below 1
depends on the value of z.
The smallest b coupled with the smallest z result in the lowest V.
The online calculator onlinechannel15b is a useful tool for the analysis
and design of lined canals and channels, with the objective of
promoting hydrodynamic stability and, therefore, avoiding roll waves.
Click  to watch a video with the content shown in this article.
|
REFERENCES
Cornish, V. 1907.
Progressive waves in rivers. Journal of the Royal Geographical Society, Vol. 29, No. 1, January, 23-31.
Liggett, J. A. 1975. Stability. Chapter 6 in Unsteady Flow in Open Channels,
K. Mahmood and V. Yevjevich, eds., Water Resources Publications, Ft. Collins, Colorado.
Ponce, V. M. 1991. New perspective on the Vedernikov number. Water Resources Research,
Vol. 27, No. 7, 1777-1779, July.
Ponce, V. M., and P. J. Porras. 1995.
Effect of cross-sectional shape on free-surface instability.
Journal of Hydraulic Engineering, ASCE, Vol. 121, No. 4, April, 376-380.
Ponce, V. M. 2014.
Chow, Froude, and Vedernikov. Proceedings,
American Society of Civil Engineers (ASCE)
World Environment and Water Resources Congress, June 1-5, 2014, Portland, Oregon.
Ponce, V. M. and B. Choque Guzmán, 2019. El control de ondas pulsantes en ríos canalizados.
http://ponce.sdsu.edu/el_control_de_ondas_pulsantes.html
(Cited May 7, 2021).
Powell, R. W. 1948. Vedernikov's criterion for ultra-rapid flow. Transactions,
American Geophysical Union, Vol. 29, No. 6, 882-886.
Vedernikov, V. V. 1945. Conditions at the front of a translation wave disturbing a steady
motion of a real fluid, Dokl. Akad. Nauk SSSR, 48(4), 239-242.
|