 |
|
Fig. 1 Proposed damsite at |
LAMBAYEQUE, PERU
TASK 5: ENVIRONMENTAL IMPACT ASSESSMENT
PART 5: SECTION 6
July 24, 2009
Dr. Victor M. Ponce
Environmental Consultant
6. HUMAN RESOURCES SETTING
The human resources setting includes demographics,
economic development,
land use,
infrastructure,
housing,
education,
public health,
transportation,
recreation,
tourism, and
archaeological/historical resources.
The general region is the department of Lambayeque, along Peru's northern coast.
The specific area of influence of the proposed project is the La Leche river valley.
6.1 Demographics
The department of Lambayeque is divided into three provinces: (1) Chiclayo, (2) Lambayeque, and (3) Ferreñafe (Fig. 48).
The population of the department of Lambayeque, by provinces, is shown in Table 8.
The total population of Lambayeque (1,112,868 persons) represents 4.1% of the population of Peru. As shown in Table 8,
the province of Chiclayo concentrates (757 / 1,113) = 68% of the
population of the department of Lambayeque. The most current (2007) rate of population growth is 1.4%.
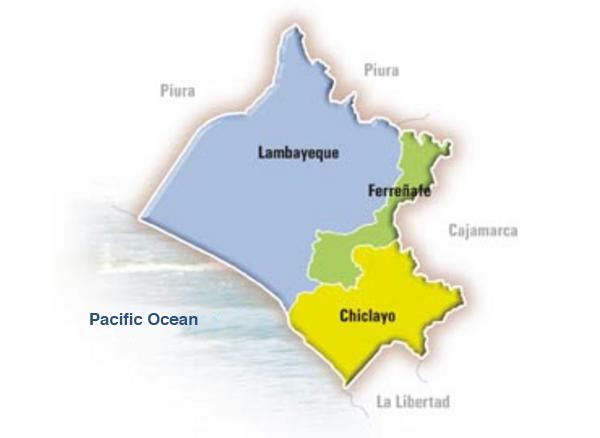 |
| Fig. 48 Map of the department of Lambayeque, Perú. |
| Table 8. Population in the department of Lambayeque. | ||||||||
| Province | Surface (km2) |
Population | ||||||
| Chiclayo | 6,211 | 757,452 | ||||||
| Lambayeque | 4,254 | 259,274 | ||||||
| Ferreñafe | 5,231 | 96,142 | ||||||
| Total | 15,696 | 1,112,868 | ||||||
| Source: Instituto Nacional de Estadística e Informática (Perú): Censo Nacional de Población y Vivienda 2007. |
The area of influence for this study is contained within the provinces of Lambayeque and Ferreñafe (Fig. 47). The province of Lambayeque has twelve (12) districts, and Ferreñafe has six (6) districts. The area of influence comprises the districts of Íllimo, Jayanca, Pacora and Túcume, in the province of Lambayeque, and Pítipo, in the province of Ferreñafe. The location of the towns (within the districts), relative to the La Leche valley, is shown in Fig. 49. The entrance to the town of Íllimo is shown in Fig. 50.
The population by districts, estimated for 2009, is shown in Table 9. The urban rural and urban population, by districts, is shown in Table 10. The rural population is 62.3% of the total. The district of Pítipo has 39.6% of the population. The population growth projection in the area of influence is shown in Table 11. The area of Pítipo has the highest growth rate (3.6%).
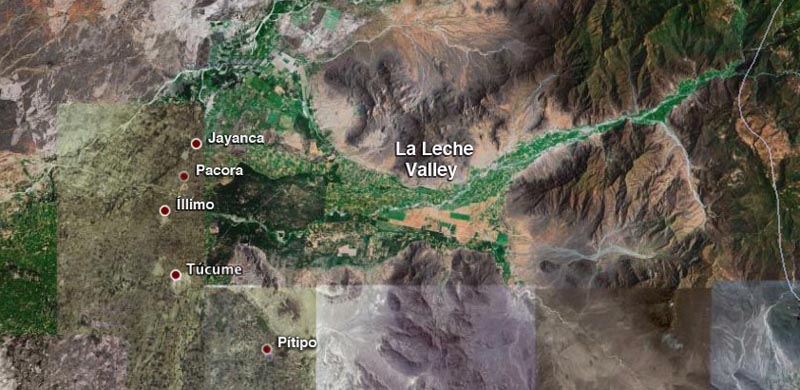 |
| Fig. 49 Satellite view of the area of influence. |
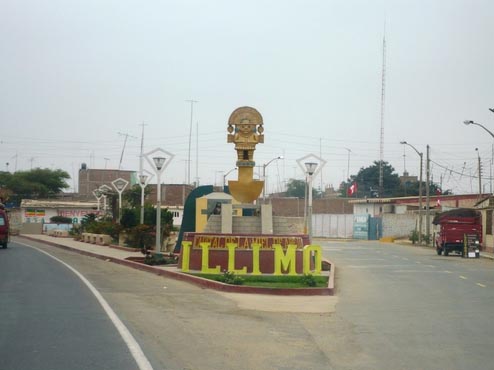 |
| Fig. 50 Entrance to the town of Illimo. |
| Table 9. Estimated population in the area of influence (2009). | ||||||||
| Province | District | Population (persons) |
||||||
| Lambayeque | Íllimo | 9,693 | ||||||
| Jayanca | 14,959 | |||||||
| Pacora | 7,412 | |||||||
| Túcume | 22,589 | |||||||
| Ferreñafe | Pítipo | 21,272 | ||||||
| Total | 75,925 | |||||||
| Source: Instituto Nacional de Estadística e Informática (Perú). |
| Table 10. Rural and urban population in the area of influence. | ||||||||
| Province | District | Population | ||||||
| Rural | Urban | Total | ||||||
| Lambayeque | Íllimo | 5,706 | 4,710 | 10,416 | ||||
| Jayanca | 10,402 | 9,994 | 20,396 | |||||
| Pacora | 4,693 | 4,945 | 9,638 | |||||
| Túcume | 22,681 | 12,807 | 35,488 | |||||
| Ferreñafe | Pítipo | 34,824 | 14,887 | 49,711 | ||||
| Total | 78,306 | 47,343 | 125,649 | |||||
| Source: Instituto Nacional de Estadística e Informática (Perú). |
| Table 11. Population growth projections in the area of influence. | ||||||||
| Province | District | Population of more than 15 of age | ||||||
| Persons | Percentage of total |
Growth rate (%) |
||||||
| Lambayeque | Íllimo | 6,929 | 66.5 | 0.3 | ||||
| Jayanca | 13,645 | 66.9 | 1.3 | |||||
| Pacora | 6,426 | 66.7 | 1.1 | |||||
| Túcume | 22,755 | 64.1 | 1.9 | |||||
| Ferreñafe | Pítipo | 32,486 | 65.4 | 3.6 | ||||
| Total | 82,241 | 65.9 | - | |||||
| Source: Instituto Nacional de Estadística e Informática (Perú) (1995-2000). |
6.2 Economic development
The area of influence of this study can be characterized with respect to level of economic development
by using the Unsatisfied Basic Necessities (UBN)
indicator.
This indicator reflects the shortage of a basic necessity, such as substandard housing, overcrowding, lack of sewage, or lack of schooling for children.
Table 12 shows the UBN percentage, by provinces and districts, including Chiclayo and Lambayeque,
for comparison purposes. Pítipo
is shown to have the highest value of UBN (60.9%) and Jayanca the lowest (45.2%).
The lowest UBN values (better living conditions) correspond to the predominantly urban districts of Chiclayo and Lambayeque.
Table 13 shows the population listed by type of unsatisfied basin necessity in the area of influence.
Lack of sewage has the highest percentage of UBN, with Pítipo showing the highest percentage of lack of sewage (37.4%).
| Table 12. Population with at least one unsatified basic necessity (UBN) in the area of influence and vicinity. | ||||||||
| Province | District | Total number of homes |
Homes with UBN | |||||
| Number | Percentage (%) |
|||||||
| Chiclayo | Chiclayo | 49,087 | 14,725 | 30.0 | ||||
| Lambayeque | Lambayeque | 8,497 | 3,451 | 40.6 | ||||
| Íllimo | 1,601 | 782 | 48.8 | |||||
| Jayanca | 2,286 | 1,034 | 45.2 | |||||
| Pacora | 1,198 | 555 | 46.3 | |||||
| Túcume | 3,080 | 1,589 | 51.6 | |||||
| Ferreñafe | Pítipo | 2,764 | 1,682 | 60.9 | ||||
| Source: III Censo Nacional Agropecuario 2007. |
| Table 13. Population listed by type of unsatified basic necessity (UBN) in the area of influence. | ||||||||||||
| District | Total number of homes |
Substandard housing | Overcrowding | No sewage | Children not attending school | Persons with high economic dependence | ||||||
| No. | % | No. | % | No. | % | No. | % | No. | % | |||
| Íllimo | 1,601 | 149 | 9.3 | 239 | 14.9 | 236 | 14.7 | 134 | 8.4 | 327 | 20.4 | |
| Jayanca | 2,286 | 422 | 18.5 | 247 | 10.8 | 284 | 12.4 | 116 | 5.1 | 412 | 18.0 | |
| Pacora | 1,198 | 184 | 15.4 | 147 | 12.3 | 171 | 14.3 | 83 | 6.9 | 208 | 17.4 | |
| Túcume | 3,080 | 398 | 12.9 | 436 | 14.2 | 588 | 19.1 | 313 | 10.2 | 699 | 22.7 | |
| Pítipo | 2,764 | 508 | 18.4 | 282 | 10.2 | 1,035 | 37.4 | 222 | 8.0 | 552 | 20.0 | |
| Source: III Censo Nacional Agropecuario 2007. |
Immigration and emigration are indicators of economic activity. Table 14 shows inmigration and emigration data in the department of Lambayeque for the year 2007. Inmigration to Lambayeque originates in the neighboring department of Cajamarca, particularly from the provinces of Chota and Cutervo. The existence of a good road between Cajamarca and Chiclayo encourages the movement of people, and of goods and services. In 2007, more people emigrated out of Lambayeque than immigrated into it.
| Table 14. Immigration and emigration in the department of Lambayeque. | ||||||||
| Department | Immigrants | Emigrants | Balance | Immigrant rate | Emigrant rate | Net rate | ||
| Lambayeque | 64,952 | 66,046 | (1,094) | 16.5 | 16.8 | (-0.3) | ||
| Source: Instituto Nacional de Estadística e Informática (Perú): Censo Nacional de Población y Vivienda 2007. |
Table 15 shows the migratory trends from selected northern departments to neighboring cities (2007). For instance, 28.0% of the immigrants to the city of Chiclayo originated in the department of Cajamarca, while 6.0% of the immigrants to the city of Cajamarca originated in the department of Lambayeque.
| Table 15. Immigration from departments to northern cities. | ||||||||
| Northern city | Inmigration by department (%) | |||||||
| Lambayeque | Cajamarca | Piura | Lima-Callao | Other | ||||
| Tumbes | 12.3 | 2.8 | 38.0 | 19.5 | 46.9 | |||
| Piura | 6.0 | 2.2 | 57.3 | 19.4 | 34.5 | |||
| Sullana | 4.2 | 1.7 | 60.8 | 18.0 | 33.3 | |||
| Talara | 4.4 | 0.7 | 56.9 | 23.3 | 38.0 | |||
| Chiclayo | 26.6 | 28.0 | 9.2 | 14.5 | 36.2 | |||
| Trujillo | 3.6 | 10.3 | 5.5 | 12.7 | 80.6 | |||
| Chachapoyas | 5.5 | 6.1 | 0.8 | 16.9 | 87.6 | |||
| Cajamarca | 6.0 | 53.8 | 1.4 | 16.2 | 38.8 | |||
| Source: Instituto Nacional de Estadística e Informática (Perú): Migraciones internas del Perú 2007. |
Employment trends are a good indicator of economic activity. Table 16 shows employment figures for the department of Lambayeque for 1981 and 1993. The percentage of women in economic activities appears to be increasing. Likewise, the percentage of gainfully employed women appears to be on the rise.
| Table 16. Economically active population, older than 15 years of age, in the department of Lambayeque. | |||||||||||||
| Condition of activity | Year 1981 | ||||||||||||
| Total | Men | Women | |||||||||||
| No. | % | No. | % | No. | % | ||||||||
| 1. Population | 383,051 | 100.0 | 185,661 | 100.0 | 197,390 | 100.0 | |||||||
| a. | Economically active | 184,388 | 48.1 | 144,100 | 77.6 | 40,288 | 20.4 | ||||||
| b. | Economically inactive | 198,663 | 51.9 | 41,561 | 22.4 | 157,102 | 79.6 | ||||||
| 2. Economically active population | 184,388 | 100.0 | 144,100 | 100.0 | 40,288 | 100.0 | |||||||
| a. | Employed | 168,691 | 91.5 | 135,627 | 94.1 | 33,064 | 82.1 | ||||||
| b. | Unemployed | 15,697 | 8.5 | 8,473 | 5.9 | 7,224 | 17.9 | ||||||
| Source: Instituto Nacional de Estadística e Informática 2007. |
| Table 16. (Continued). | |||||||||||||
| Condition of activity | Year 1993 | ||||||||||||
| Total | Men | Women | |||||||||||
| No. | % | No. | % | No. | % | ||||||||
| 1. Population | 578.251 | 100.0 | 275,769 | 100.0 | 302,482 | 100.0 | |||||||
| a. | Economically active | 269,812 | 46.7 | 199,622 | 72.4 | 70,190 | 23.2 | ||||||
| b. | Economically inactive | 308,439 | 53.3 | 76,147 | 27.6 | 232,292 | 76.8 | ||||||
| 2. Economically active population | 269,812 | 100.0 | 199,622 | 100.0 | 70,190 | 100.0 | |||||||
| a. | Employed | 240,636 | 89.2 | 178,680 | 89.5 | 61,956 | 88.3 | ||||||
| b. | Unemployed | 29,176 | 10.8 | 20,942 | 10.5 | 8,234 | 11.7 | ||||||
| Source: Instituto Nacional de Estadística e Informática 2007. |
6.3 Land use
Agriculture is an important land use and economic activity in the area of influence. Table 17 shows that
the province of Lambayeque (the largest of all three provinces) has the most
farmers and the largest farmed surface area.
Table 18 shows the number of farmers and farmed surface area in the area of influence. Túcume has the most farmers,
while Pítipo has the largest surface area under cultivation.
Table 19 shows the type of ownership of farmland. Pítipo has two large farmer communities
[comunidades campesinas], while
Íllimo has the largest number of small individual landowners.
| Table 17. Number of farmers and farmed surface area in department of Lambayeque, by provinces. | ||||||||
| Province | Farmers | Farmed surface area | ||||||
| Number | % | Ha. | % | |||||
| Chiclayo | 12,993 | 29.3 | 179,116 | 25.1 | ||||
| Lambayeque | 21,998 | 49.6 | 376,944 | 52.8 | ||||
| Ferreñafe | 9,361 | 21.1 | 157,708 | 22.1 | ||||
| Total | 44,352 | 100.0 | 713,768 | 100.0 | ||||
| Source: Instituto Nacional de Estadística e Informática: III Censo Nacional Agropecuario 1994. |
| Table 18. Number of farmers and farmed surface area in the area of influence. | ||||||||
| Province | District | Farmers | Farmed surface area | |||||
| Number | % | Ha. | % | |||||
| Lambayeque | Íllimo | 1,136 | 14.4 | 2,018 | 2.2 | |||
| Jayanca | 1,540 | 19.5 | 21,496 | 23.4 | ||||
| Pacora | 1,295 | 16.4 | 6,839 | 7.5 | ||||
| Túcume | 2,242 | 28.4 | 6,381 | 6.9 | ||||
| Ferreñafe | Pítipo | 1,682 | 21.3 | 55,051 | 60.0 | |||
| Total | 7,895 | 100.0 | 91,785 | 100.0 | ||||
| Source: Instituto Nacional de Estadística e Informática: III Censo Nacional Agropecuario 1994. |
| Table 19. Type of ownership of farmland in the area of influence. | ||||||||||||||||||||
| District | Total | Individually owned | Society of fact | Society of limited responsibility | Corporation | Farmer group | ||||||||||||||
| No. | Area (Ha) |
No. | Area (Ha) |
No. | Area (Ha) |
No. | Area (Ha) |
No. | Area (Ha) |
No. | Area (Ha) |
|||||||||
| Íllimo | 1,136 | 2,018 | 1,121 | 1,976 | 14 | 40 | - | - | - | - | - | - | ||||||||
| Jayanca | 1,540 | 21,496 | 1,524 | 11,882 | 4 | 812 | 3 | 280 | 3 | 853 | 2 | 1,300 | ||||||||
| Pacora | 1,295 | 6,839 | 1,277 | 6,588 | 16 | 187 | - | - | 1 | 61 | - | - | ||||||||
| Túcume | 2,242 | 6,381 | 2,208 | 5,960 | 32 | 87 | - | - | 1 | 5 | - | - | ||||||||
| Pítipo | 1,682 | 55,051 | 1,614 | 7,261 | 60 | 324 | 2 | 22 | - | - | 1 | 3,804 | ||||||||
| Source: Instituto Nacional de Estadística e Informática: III Censo Nacional Agropecuario 1994. |
| Table 19. (Continued). | ||||||||||||||||||||
| District | Farmer community | Agricultural cooperative | Workers' agricultural cooperative | Other | ||||||||||||||||
| No. | Area (Ha) |
No. | Area (Ha) |
No. | Area (Ha) |
No. | Area (Ha) |
|||||||||||||
| Íllimo | - | - | - | - | - | - | 1 | 2 | ||||||||||||
| Jayanca | - | - | 1 | 251 | - | - | 3 | 6,118 | ||||||||||||
| Pacora | - | - | - | - | - | - | 1 | 3 | ||||||||||||
| Túcume | - | - | 1 | 329 | - | - | - | - | ||||||||||||
| Pítipo | 2 | 39,456 | - | - | 1 | 4,182 | 2 | 2 | ||||||||||||
| Source: Instituto Nacional de Estadística e Informática: III Censo Nacional Agropecuario 1994. |
Table 20 shows the different types of land use in the area of influence. Most of the agricultural lands are under irrigation. Jayanca and Pítipo have the largest fraction of nonagricultural land.
| Table 20. Land use in the area of influence. | ||||||||||||||||||||
| District | Total * | Agricultural land | Nonagricultural land | |||||||||||||||||
| Total | Under irrigation | Dryland farming | Total | Natural grass | Hills and forests | Other | ||||||||||||||
| No. | Area (Ha) |
No. | Area (Ha) |
No. | Area (Ha) |
No. | Area (Ha) |
No. | Area (Ha) |
No. | Area (Ha) |
No. | Area (Ha) |
No. | Area (Ha) |
|||||
| Íllimo | 1,132 | 2,015.64 | 1,091 | 1,780.26 | 1,086 | 1,767.68 | 15 | 12.58 | 216 | 235.38 | 7 | 5.25 | 190 | 217.03 | 23 | 13.10 | ||||
| Jayanca | 1,529 | 21,496.24 | 1,363 | 8,739.09 | 1,362 | 8,729.09 | 1 | 10.00 | 654 | 12,757.15 | 61 | 137.16 | 499 | 11,139.68 | 117 | 1,480.31 | ||||
| Pacora | 1,285 | 6,802.60 | 1,252 | 5,737.89 | 1,251 | 5,709.89 | 9 | 28.00 | 754 | 1,064.71 | - | - | 343 | 739.26 | 537 | 325.45 | ||||
| Túcume | 2,240 | 6,380.47 | 2,227 | 5,500.21 | 2,224 | 5,482.91 | 13 | 17.30 | 684 | 880.26 | 1 | 1.00 | 275 | 637.10 | 450 | 242.16 | ||||
| Pítipo | 1,630 | 55,042.18 | 1,484 | 5,541.48 | 1,484 | 5,541.48 | - | - | 690 | 49,500.70 | - | - | 461 | 9,497.86 | 40,002.84 | |||||
| Source: Instituto Nacional de
Estadística e Informática: III Censo Nacional Agropecuario 1994. * Does not include abandoned units or those that do not own land. |
Table 21 shows land use by farm size. The permanent crop type is fruits under irrigation. The permanent crops are lemon, mango, passion fruit, orange, coconut, cherry, plums, and grapes. The temporary crop types are: (a) cereals (yellow corn, rice), (b) fruits (banana, papaya, watermelon), (c) vegetables (carrots, squash, choclo corn), (d) beans (Castilla beans, Chilean beans, lentils), (e) tubers (yuca, potato, sweet potato), (f) fodder (sorghum, oats), (g) industrial crops (sugar cane), and (h) others (flowers).
| Table 21. Land use by farm size in the area of influence. | ||||||||||||||||||||
| District | Crop type |
Total | Farm size (Ha) | |||||||||||||||||
| < 0.5 | 0.5-4.9 | 5-19.9 | 20-49.9 | 50-99.9 | 100-499.9 | ≥ 500 | ||||||||||||||
| No. | Area | No. | Area | No. | Area | No. | Area | No. | Area | No. | Area | No. | Area | No. | Area | |||||
| Íllimo | Permanent | 24 | 8.35 | 6 | 0.75 | 17 | 6.60 | 1 | 1.00 | - | - | - | - | - | - | - | - | |||
| Temporary | 480 | 583.45 | 83 | 22.45 | 357 | 420.06 | 40 | 140.94 | - | - | - | - | - | - | - | - | ||||
| Jayanca | Permanent | 226 | 412.09 | 16 | 3.88 | 134 | 100.38 | 61 | 82.33 | 7 | 13.75 | 2 | 43.00 | 5 | 163.00 | 1 | 5.75 | |||
| Temporary | 279 | 1,193.07 | 3 | 0.75 | 108 | 98.82 | 145 | 359.25 | 11 | 67.25 | 4 | 125.00 | 6 | 329.00 | 2 | 213.00 | ||||
| Pacora | Permanent | 162 | 90.95 | 1 | 0.25 | 90 | 41.22 | 63 | 44.13 | 7 | 4.35 | 1 | 1.00 | - | - | - | - | |||
| Temporary | 440 | 1,093.67 | 202 | 239.99 | 225 | 612.43 | 10 | 123.25 | 3 | 118.00 | - | - | - | - | - | - | ||||
| Túcume | Permanent | 37 | 13.81 | 7 | 1.00 | 26 | 7.26 | 3 | 3.55 | 1 | 2.0 | - | - | - | - | - | - | |||
| Temporary | 1,544 | 3,159.30 | 84 | 22.84 | 1,207 | 1,729.17 | 241 | 1,116.54 | 10 | 160.75 | 1 | 55.00 | 1 | 75.00 | - | - | ||||
| Pítipo | Permanent | 41 | 22.27 | 1 | 0.25 | 27 | 10.52 | 12 | 10.50 | - | - | - | - | - | - | 1 | 1.00 | |||
| Temporary | 926 | 1,541.38 | 15 | 3.65 | 681 | 768.43 | 212 | 537.80 | 13 | 138.50 | 4 | 84.00 | - | - | 1 | 9.00 | ||||
| Source: Instituto Nacional de Estadística e Informática: III Censo Nacional Agropecuario 1994. |
Table 22 shows the number of users of agricultural inputs in the department of Lambayeque. It is seen that a substantial number of farmers use pesticides in their operations, followed by chemical fertilizers. A small number are knowledgeable in the use of biological controls.
| Table 22. Users of agricultural inputs in the department of Lambayeque. | ||||||||
| Agricultural inputs | Have knowledge of biological control | |||||||
| 1. Improved seeds or plants | 2. Organic fertilizer | 3. Chemical fertilizer | 4. Pesticides | 5. Herbicides | 6. Fungicides | Uses all (1-6) | Does not use any | |
| 5,185 | 5,246 | 10,968 | 15,365 | 1,248 | 5,354 | 130 | 5,172 | 2,742 |
| Source: Instituto Nacional de Estadística e Informática (Perú): Censo Nacional de Población y Vivienda 2007. |
Table 23 shows the activity on animal husbandry in the area of influence, compared with that of the department of Lambayeque.
The animals raised are cattle, sheep, pigs, and poultry. Goats are only raised for local consumption.
Commercialization is based on meat and dairy products. Pítipo shows the highest level of poultry production
in the area of influence.
| Table 23. Animal husbandry in the area of influence, compared with department of Lambayeque. | ||||||||||||||||||||
| Department strict |
Total number of units |
Cattle | Sheep | Pigs | Poultry | |||||||||||||||
| Units | Head | Pure- bred |
Units | Head | Pure- bred |
Units | Head | Pure- bred |
Units | No. of chicken |
||||||||||
| Lambayeque | 24,618 | 11,139 | 50,522 | 5,724 | 8,405 | 65,064 | 4,118 | 10,592 | 36,567 | 4,151 | 11,619 | 99,894 | ||||||||
| Íllimo | 1,132 | 287 | 807 | 13 | 200 | 955 | 64 | 347 | 940 | 52 | 285 | 1,927 | ||||||||
| Jayanca | 1,540 | 605 | 2,367 | 116 | 274 | 1,767 | 6 | 502 | 1,849 | 1 | 566 | 8,777 | ||||||||
| Pacora | 1,288 | 308 | 835 | 32 | 243 | 1,304 | 5 | 351 | 1,033 | 21 | 256 | 2,047 | ||||||||
| Túcume | 2,241 | 882 | 2,386 | 66 | 526 | 2,258 | 106 | 934 | 2,525 | 101 | 898 | 6,648 | ||||||||
| Pítipo | 1,678 | 859 | 3,620 | 315 | 413 | 3,191 | 36 | 711 | 2,896 | 114 | 869 | 12,976 | ||||||||
| Source: Instituto Nacional de Estadística e Informática: III Censo Nacional Agropecuario 1994. |
6.4 Infrastructure
The availability of water and sewage to the population is a measure of infrastructure development.
Table 24 shows the type of water supply in the area of influence.
The predominant type is from wells, particularly in
Pacora (72.6%), Pítipo (53.0%), and Illimo (52.7%).
| Table 24. Water supply in the area of influence. | ||||||||||
| District | Number of installations | Type of water supply/service | ||||||||
| Piped, inside | Piped, outside | Public, centrally shared | Well | Truck tank | River, stream, or canal | Other | ||||
| Íllimo | 1,574 | 532 | 2 | 121 | 829 | 7 | 10 | 73 | ||
| Jayanca | 2,208 | 946 | 9 | 268 | 885 | 21 | 22 | 57 | ||
| Pacora | 3,050 | 538 | 2 | 42 | 2,215 | 146 | 68 | 39 | ||
| Túcume | 1,188 | 424 | 0 | 113 | 576 | 3 | 7 | 65 | ||
| Pítipo | 2,737 | 355 | 8 | 55 | 1,450 | 13 | 847 | 9 | ||
| Source: Instituto Nacional de Estadística e Informática (Perú). |
6.5 Housing resources
Table 25 shows the wall material in housing in the department of Lambayeque, by provinces. It is seen that adobe
is the predominant wall material in the provinces of Lambayeque and Ferreñafe, which comprise the area of interest.
| Table 25. Housing wall material in department of Lambayeque and its provinces. | ||||||||||
| Province | Number of structures | Predominant wall material (% of all materials) | ||||||||
| Brick | Stone | Adobe | Straw & mud |
Stone & mud |
Wood | Straw mat |
Other | |||
| Chiclayo | 114,082 | 38.8 | 0.7 | 57.1 | 1.8 | 0.4 | 0.2 | 0.5 | 0.5 | |
| Lambayeque | 37,188 | 13.1 | 0.3 | 70.2 | 13.9 | 0.4 | 1.6 | 0.2 | 0.3 | |
| Ferreñafe | 18,055 | 8.3 | 0.2 | 84.3 | 6.5 | 0.3 | 0.1 | 0.1 | 0.2 | |
| Total | 169,325 | 29.9 | 0.5 | 62.9 | 5.0 | 0.4 | 0.5 | 0.4 | 0.4 | |
| Source: Instituto Nacional de Estadística e Informática (Perú). |
6.6 Educational resources
Table 26 shows the number of people registered in the educational systems, including the department of Lambayeque, for comparison
purposes. Table 27 shows the literacy rate in the area of influence, and
also for the entire department of Lambayeque, for comparison purposes. It is seen that Lambayeque ranks 10 among 24 departments, while
the districts of the area of influence rank in order between No. 440 to No. 610 among all districts (1785 districts in the 1993 Census).
| Table 26. Number of people registered in the educational systems. | ||||||||||||||||||||
| Department* or district |
Pre-school | Primary | Secondary | Other secondary | College/university | |||||||||||||||
| Minors | Adults | Minors | Adults | Special | Occupational | Teachers | Technology | Art | ||||||||||||
| Lambayeque* | 21,764 | 157,372 | 2,260 | 8,446 | 6,996 | 705 | 8,797 | 4,574 | 8,994 | 248 | ||||||||||
| Íllimo | 220 | 2,039 | - | 888 | 106 | - | 86 | - | 82 | - | ||||||||||
| Jayanca | 200 | 2,434 | 28 | 1,292 | 102 | 30 | 280 | - | - | - | ||||||||||
| Pacora | 208 | 3,594 | - | 1,335 | 64 | - | 208 | 44 | - | - | ||||||||||
| Túcume | 206 | 1,583 | - | 601 | 122 | - | 121 | - | - | - | ||||||||||
| Pítipo | 333 | 3,013 | - | 1,040 | - | - | - | - | - | - | ||||||||||
| Source: Instituto Nacional de Estadística e Informática (INEI). |
| Table 27. Literacy rate in the area of influence. | ||||||||
| Department* or district |
Literacy rate | |||||||
| Percentage (%) |
National ranking (among departments or districts) |
|||||||
| Lambayeque* | 92.6 | 10 | ||||||
| Íllimo | 92.5 | 441 | ||||||
| Jayanca | 90.3 | 610 | ||||||
| Pacora | 90.5 | 597 | ||||||
| Túcume | 90.9 | 572 | ||||||
| Pítipo | - | - | ||||||
| Source: Instituto Nacional de Estadística e Informática: Censo Nacional. |
6.7 Public health resources
The availability of public health services, such as hospitals and clinics, is a measure of socioeconomic development.
There are a total of twenty-one (21) health service facilities in the area of influence and vicinity, as shown in Table 28.
The city of Chiclayo has one hospital. There are no hospitals in the area of influence.
Typical demographic indicators related to public health are shown in Table 29.
The principal causes of death in the department of Lambayeque during the period 1996-1998 are listed in Table 30.
Heart disease, respiratory diseases, and cancer are the three major killers in the region.
| Table 28. Health services in the area of influence. | ||||||||
| Department* or province |
District | Hospitals | Health centers |
Local health centers |
Total | |||
| Lambayeque* | - | 1 | 2 | 2 | 5 | |||
| Lambayeque | Íllimo | - | 1 | 2 | 3 | |||
| Jayanca | - | 1 | 1 | 2 | ||||
| Pacora | - | 1 | 1 | 2 | ||||
| Túcume | - | 1 | 5 | 6 | ||||
| Ferreñafe | Pítipo | - | 1 | 2 | 4 | |||
| Total | - | 1 | 7 | 13 | 21 | |||
| Source: Instituto Nacional de Estadística e Informática: Censo Nacional. |
| Table 29. Demographic indicators in the department of Lambayeque, period 1995-2000. | ||||||||
| Indicator | Value | |||||||
| Fertility | Number of births per year | 24,739 | ||||||
| Number of children per woman | 2.7 | |||||||
| Number of births per 1000 persons per year | 23.8 | |||||||
| Mortality | Number of deaths per year | 6,018 | ||||||
| Number of deaths per 1000 persons per year | 5.8 | |||||||
| Infant mortality per 1000 live births, all | 36 | |||||||
| Infant mortality per 1000 live births, among women | 33 | |||||||
| Infant mortality per 1000 live births, among men | 40 | |||||||
| Life expectancy | Life expectancy at birth (years), all | 70.7 | ||||||
| Life expectancy at birth (years), among women | 73.3 | |||||||
| Life expectancy at birth (years), among men | 68.3 | |||||||
| Population growth rate (natural) (%) | 2 | |||||||
| Source: Instituto Nacional de Estadística e Informática (Perú): Censo Nacional de Población y Vivienda 2007. |
| Table 30. Principal cause of death in the department of Lambayeque, 1996-1998. | ||||||||
| Illness | 1996 | 1997 | 1998 | |||||
| No. of cases | % | No. of cases | % | No. of cases | % | |||
| Circulation diseases | 776 | 19.8 | 797 | 18.9 | 524 | 19.7 | ||
| Cancer | 603 | 15.4 | 653 | 15,5 | 324 | 12.2 | ||
| Respiratory diseases | 587 | 15.0 | 641 | 15.2 | 512 | 19.3 | ||
| Traumatism and poisoning | 384 | 9.8 | 410 | 9.7 | 235 | 8.9 | ||
| Digestive system | 270 | 6.9 | 301 | 7.1 | 146 | 5.5 | ||
| Birth related | 157 | 4.0 | 154 | 3.7 | 96 | 3.6 | ||
| Heart | 138 | 3.5 | 150 | 3.6 | 88 | 3.3 | ||
| Diabetes | 96 | 2.5 | 119 | 2.8 | 67 | 2.5 | ||
| Intestinal infections | 49 | 1.3 | 64 | 1.5 | 153 | 5.8 | ||
| Tuberculosis | 76 | 1.9 | 85 | 2.0 | 45 | 1.7 | ||
| Source: Ministerio de Salud (Peru). |
6.8 Transportation resources
The Panamerican Highway crosses the department of Lambayeque, and it crosses the towns of Túcume, Íllimo, Pacora, and Jayanca.
Other paved roads in the area of influence are the Chiclayo-Ferreñafe and the
Chiclayo-Batán Grande roads. All other roads are unpaved.
Table 31 shows the density of roads in the area of influence. All five districts are shown to have low road density.
| Table 31. Density of roads in the area of influence. | ||||||||
| Province | District | Surface area (km2) |
Length of roads (km) |
Road density (km/km2) |
||||
| Lambayeque | Íllimo | 24.37 | 20.68 | 0.85 | ||||
| Jayanca | 680.96 | 97.48 | 0.14 | |||||
| Pacora | 87.79 | 76.67 | 0.87 | |||||
| Túcume | 67.00 | 51.81 | 0.77 | |||||
| Ferreñafe | Pítipo | 558.18 | 114.42 | 0.11 | ||||
| Source: Georeferenced mapping of the highway and road network in Lambayeque (PEOT). |
6.9 Recreational and cultural resources
The department of Lambayeque has a very rich cultural legacy from the ancient cultures which fluorished in the region prior
to the Spanish conquest (1532). This cultural legacy is currently expressed in the various festivities [fiestas], which
provide relaxation and enjoyment to the predominantly agricultural peoples.
The festivities are related to the practice of Roman Catholicism, which is the principal religion in the region. Major festivities
in the area of influence, including dates, are listed in Table 32.
| Table 32. Festivities in the area of influence. | ||||||||
| Province | District | Festivities | Date | Place | ||||
| Lambayeque | Íllimo | Niño Dios de Reyes | August 04 | Íllimo | ||||
| San Juan | June 24 | Íllimo | ||||||
| Niño Dios de Pascua | December 25 | Íllimo | ||||||
| Jayanca | Anniversary | November 07 | Jayanca | |||||
| Cruz del Canal | May 25 | Jayanca | ||||||
| Cruz del Río | May 05 | Jayanca | ||||||
| Cruz de Alameda | April 03 | Jayanca | ||||||
| Pacora | San Francisco | October 04 | Huaca Rivera | |||||
| Vírgen Mercedes | September 24 | Cerro E. | ||||||
| La Candelaria | February 02 | Pacora | ||||||
| Túcume | Purísima Concepción | February | Túcume | |||||
| Purísima Concepción | August | Granja Sasape | ||||||
| San Antonio | June | La Raya | ||||||
| Señor Cautivo | September | Túcume Viejo | ||||||
| Señor de los Milagros | October | Sasape Viejo | ||||||
| Ferreñafe | Pítipo | Vírgen de Fátima | May 13 | Pítipo | ||||
| Vírgen del Carmen | May 25 | Cachinche | ||||||
| Cruz de Pativila | May 19 | Pativila | ||||||
| Cruz de Chalpón | May 19 | Batán Grande | ||||||
| Source: Instituto Nacional de Estadística e Informática: Compendio Estadístico Departamental 1996-1997, Lambayeque. |
6.10 Tourism resources
The department of Lambayeque is an important tourist destination in Peru.
Of particular note are the large number of archaeological remains which are sprinkled throughout the region,
and which continue to arouse the interest of both archaeologists and laypersons.
The remains are a tribute to the ancient civilizations which flourished in the valleys of the department of Lambayeque, from the first
century A.D. to the advent of the Spanish conquest (XVI century). The proto-Mochica, Mochica, Sicán,
Chimú, and Inca are worthy of mention. All left their mark on the land by building impressive works of
architecture, many of which stand majestic to this date.
The region has a number of excellent museums, among which are the Tumbas Reales and Brüning, in the city of Lambayeque,
and the Sicán National Museum, in the city of Ferreñafe. There is also the Site Museum at Túcume.
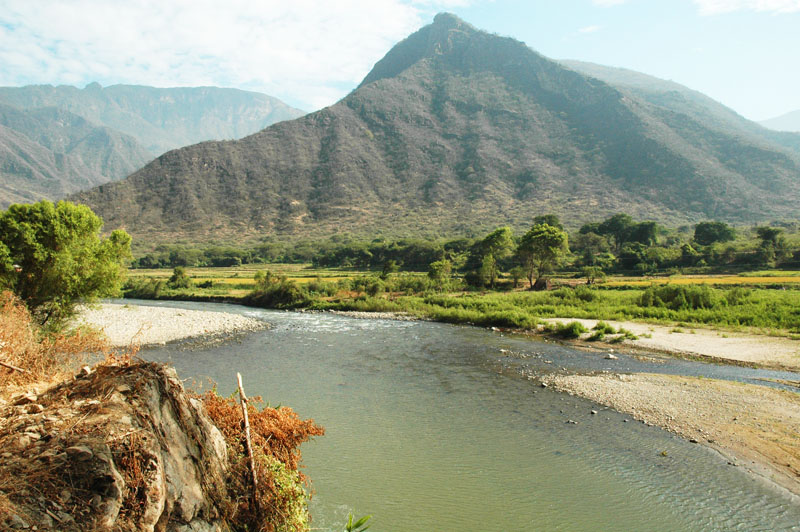
Other tourist attractions in the area of influence are listed in Table 33. For instance,
the Río La Leche at Tres Puentes is used by locals for
recreation (Fig. 51).
| Table 33. Tourist attractions in the area of influence. | ||||||||
| Province | District | Attraction | Location | |||||
| Lambayeque | Íllimo | - | - | |||||
| Jayanca | Ojo de Toro | La Viña | ||||||
| Huaca Chilili | La Tomasita | |||||||
| Pacora | Huaca Las Banderas | Santa Isabel | ||||||
| Túcume | Ruinas de La Raya | La Raya | ||||||
| Santos Vena | Túcume | |||||||
| Ruina Túcume Viejo | Túcume Viejo | |||||||
| Ferreñafe | Pítipo | Carro El Gigante | Cachinche | |||||
| Piscina | Mayascón | |||||||
| Cascada | Mayascón | |||||||
| Río La Leche | Tres Puentes | |||||||
| Source: Instituto Nacional de Estadística e Informática: Compendio Estadístico Departamental 1996-1997, Lambayeque. |
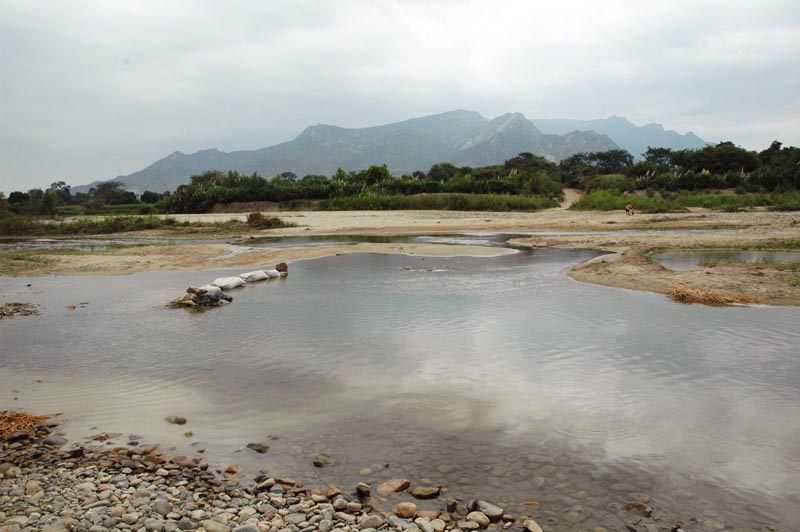 |
| Fig. 51 Río La Leche at Tres Puentes. |
6.11 Archaeological/historical resources
Archaeology is a way of life in the department of Lambayeque and the area of influence of this study.
Sprinkled along the valleys of the rivers Chancay, La Leche, and Motupe are close to sixty (60)
archaeological remains, which depict a high level of cultural development of the ancient peoples
of the region. Many of these sites remain to be uncovered.
Only in the Bosque de Pomac, on the floodplain of the La Leche river,
there are more than twenty (20) huacas, which are human-built pyramids made with adobe bricks.
While these structures may have been used for ceremonial purpose,
they may have also served the purpose of shelter from the recurrent floods.
Thus, the El Niño phenomenon and the related floods in the coastal desert
have conditioned life in the region from ancient times to the present.
The principal archaeological remains in the area of influence are shown in Table 34.
A substantial number of golden artifacts have been found and continue to be found in the huacas of Lambayeque.
These artifacts are exhibited in local and national museums.
A Golden Tumi, characteristic of the Sicán culture, found in Huaca La Ventana, is shown in Fig. 52.
This piece represents an anthropomorphic figure
on top of a rectangular base with a protruding knife of half-moon shape. The piece has a height of 31.03 cm.
The historical resources are closely tied to the archaeological resources. In ancient times, the region was the center of
development of several indigenous cultures, among which are the Mochica, Sicán, and Chimú.
The Sicán culture flourished near Ferreñafe and the Bosque de Pomac, from 750 AD to about 1,300 AD.
Túcume, home of the largest complex of archaeological remains in the region, was the
center of the Sicán culture (Fig. 53).
The latter was
overtaken in the XIV century (around 1,350 AD) by the Chimú culture, which arrived from the South.
In turn, in the XV century (around 1,470 AD), the Chimú were conquered by the Incas, which came from Cuzco and other parts of Perú.
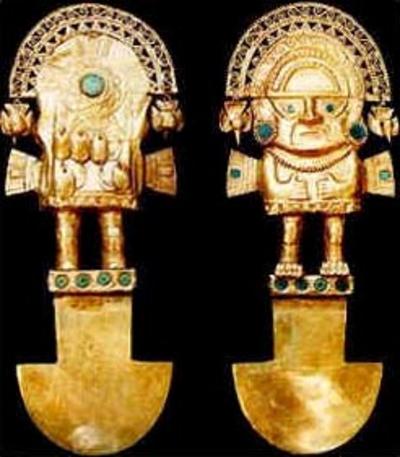 |
| Fig. 52 Golden Tumi (Source: Biblioteca de Joyería Ybarra) |
| Table 34. Principal archaeological remains in the area of influence. | ||||||||
| Province | District | Archaeological zone | ||||||
| Lambayeque | Íllimo | Huaca del Loro (El Oro) | ||||||
| Huaca de La Cruz | ||||||||
| Huaca La Merced | ||||||||
| Huaca Pintada | ||||||||
| Jayanca | Cerro Jotoro | |||||||
| Huaca La Villa | ||||||||
| Huaca Chilili | ||||||||
| Pacora | Huaca Las Banderas | |||||||
| Historical Sanctuary "Bosque de Pomac" | ||||||||
| Huaca Chilili de los Patos, Cirila | ||||||||
| Túcume | Pyramids of Túcume | |||||||
| Ferreñafe | Pítipo | Huaca Oro, La Partida, Campana | ||||||
| Huaca La Ventana | ||||||||
| Sicán Culture | ||||||||
| Archaeological Complex of Batán Grande | ||||||||
| Source: Instituto Nacional de Cultura (Perú). |
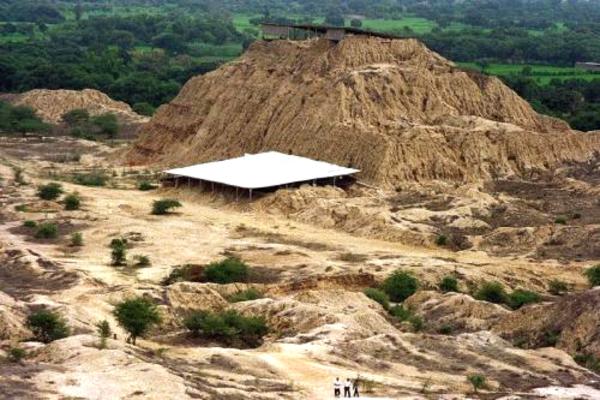 |
| Fig. 53 Pyramids of Túcume. |