 |
|
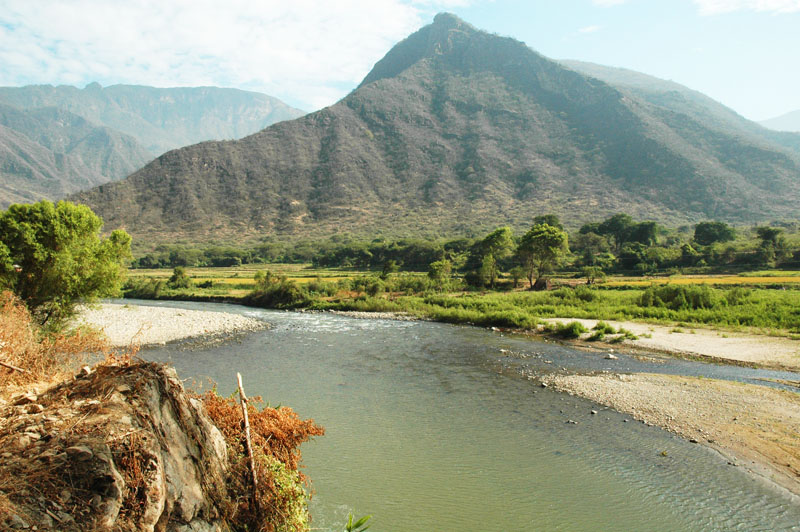
Fig. 1 Proposed damsite at |
LAMBAYEQUE, PERU
TASK 5: ENVIRONMENTAL IMPACT ASSESSMENT
PART 6: SECTIONS 7-9
July 24, 2009
Dr. Victor M. Ponce
Environmental Consultant
7. ENVIRONMENTAL LEGISLATION
The central piece of applicable legislation in Peru regarding
environmental impact assessment is the "Law of the National System of Environmental Impact Evaluation" (Ley del Sistema Nacional de Evaluación del Impacto Ambiental).
The law has the following objectives:
To establish a national system to assist in the identification, prevention,
supervision, control and anticipated correction of the negative environmental impacts derived from human actions in connection with
projects of economic development.
To establish a uniform process encompassing requirements, steps, and scope of the environmental impact evaluation.
To establish the mechanisms to assure public participation in the process of environmental impact evaluation.
The law is applicable to development projects that consist of activities or works that could cause negative environmental impacts,
as specified in the law. The law requires an environmental certification for any covered project, to be issued by the competent authority.
The projects are classified into three categories:
Projects which do not cause negative environmental impacts of significance; therefore, requiring only a Declaration
of Environmental Impact.
Projects which could cause moderate environmental impacts, and for which the negative effects can be eliminated or minimized
by the adoption of readily applicable measures; therefore, requiring a semidetailed Environmental Impact Study (EIS-sd).
Projects of such characteristics, size, and/or location, that could produce negative environmental impacts of significance,
either quantitatively or qualitatively; therefore, requiring a detailed Environmental Impact Study (EIS-d).
The law specifies the criteria for classification as follows:
Protection of public health.
Protection of environmental quality, including that or air, water, and soil, as well as the effect of noise, liquid and solid waste,
and gaseous and radiactive emissions.
Protection of natural resources, especially water, soil, flora and fauna.
Protection of designated natural protected areas.
Protection of ecosystems and scenic beauty.
Protection of the quality of life.
Protection of urban spaces.
Protection of the archaeological, historical, architectural, and monumental heritage.
Protection of other segments included in the national environmental policy.
The complexity and size of the
La Leche river flood control project requires a detailed Environmental Impact Study (EIS-d) (Category 3).
This classification is based on a careful assessment of the criteria listed above.
8. ALTERNATIVE PLANS
The La Leche river flood control project consists of two rock-fill dams: (1) at La Calzada, and (2) at Calicantro.
La Calzada is a dam with height 57.8 m and volume 137.6 hm3. The dam has an upstream face of concrete of thickness 0.35 m,
and an impermeable curtain made of a mix of cement and bentonite, of 0.5 m thickness and depth to rock (parent material).
The La Calzada dam is an instream dam, on the La Leche river at La Calzada, about 2.5 km downstream of the confluence with
of the La Leche river with Cincate Creek.
Calicantro is a dam with height 27 m and volume 40.6 hm3.
The characteristics of the Calicantro dam are similar to that of La Calzada. However, Calicantro dam is located
in Rinconada Calicantro, which drains Hualtacal Creek. Thus, Calicantro dam is an off-stream dam, since it is not located
on the La Leche river.
9. ENVIRONMENTAL IMPACT ASSESSMENT
The environmental impact assessment is performed using the following two methodologies:
The Leopold Matrix is a system for the analysis and numerical weighting of probable impacts.
The analysis does not produce an overall
quantitative rating; instead, it consists of a set of value judgments. A primary purpose is to ensure that the impact of alternative actions
is evaluated and considered in project planning (Leopold et al., 1971). A detailed description of the Leopold matrix methodology is given in
Appendix I.
The application to the La Leche flood control project is given in Section 9.1.
The Battelle Environmental Evaluation System is a methodology for performing environmental impact analysis
developed at Battelle Columbus Laboratories by an
interdisciplinary research team under contract with the U.S. Bureau of Reclamation (Dee et al., 1972; Dee et al., 1973).
It is based on a hierarchical assessment of environmental quality indicators.
A detailed description of the Battelle Environmental Evaluation System is given in
Appendix II.
The application to the La Leche flood control project is given in Section 9.2.
9.1 Application of the Leopold Matrix
The Leopold matrix is an analytical tool to evaluate the environmental impact of development projects.
The methodology sets up a matrix of actions vs factors, with each action being evaluated for its effect on
each factor. The actions are a list of proposed project
activities which could cause environmental impact. The factors are a list of existing characteristics and conditions of the environment which could
be affected by the proposed actions.
The original Leopold matrix methodology featured a comprehensive list of
100 actions and 88 factors
(see Appendix I). The application to the La Leche river flood control
project considers the eighteen (18) actions listed in Table 35.
Five types of actions are considered: (1) project features, (2) construction operations, (3) materials extraction, (4) materials processing, and (5) project hazards.
| Table 35. Actions in the modified Leopold matrix. |
| (1) | (2) | (3) |
|
ACTIONS • Proposed • |
10. Project features |
11. Dams/reservoirs |
| 12. Spillways | ||
| 13. Canals | ||
| 14. Desilting basins | ||
| 15. Access roads | ||
| 20. Construction operations |
21. Blasting and drilling | |
| 22. Cut and fill | ||
| 23. Surface excavation | ||
| 24. Subsurface excavation | ||
| 30. Materials Extraction |
31. Soil materials | |
| 32. Cement | ||
| 33. Aggregates | ||
| 40. Materials Processing |
41. Soils | |
| 42. Concrete | ||
| 43. Steel | ||
| 50. Project hazards |
51. Dam failure | |
| 52. Slope instability | ||
| 53. Explosions |
Table 36 lists seventy-three (73) factors which could be affected by the actions listed in Table 35. Factors are divided into three categories: (1) physico-chemical, (2) biological, and (3) cultural. The physico-chemical subcategories are: (1) lithosphere, (2) hydrosphere, and (3) atmosphere. The biological subcategories are: (1) terrestrial flora, (2) aquatic flora, (3) terrestrial fauna, and (4) aquatic fauna. The cultural subcategories are: (1) land use, (2) recreational, (3) aesthetic, (4) historical, (5) sociological, and (6) anthropogenic.
| Table 36. Factors in the modified Leopold matrix. |
| (1) | (2) | (3) | (4) |
FACTORS • Existing • | 100. |
110. Lithosphere |
111. Soils | 112. Soil moisture |
| 113. Albedo | |||
| 114. Nutrients | |||
| 115. Land forms | |||
| 116. Fossils | |||
| 120. Hydrosphere |
121. Surface water | ||
| 122. Groundwater | |||
| 123. Surface water quality | |||
| 124. Groundwater quality | |||
| 125. Temperature | |||
| 126. Salinity | |||
| 127. pH | |||
| 128. Redox potential | |||
| 130. Atmosphere |
131. Precipitation | ||
| 132. Relative humidity | |||
| 133. Temperature | |||
| 134. Air quality during construction |
| (1) | (2) | (3) | (4) |
FACTORS • Existing • | 200. |
210. Terrestrial Flora |
211. Trees |
| 212. Shrubs | |||
| 213. Grasses | |||
| 214. Crops | |||
| 215. Microflora | |||
| 216. Endangered species | |||
| 220. Aquatic Flora |
221. Wetland species | ||
| 222. Endangered species | |||
| 230. Terrestrial Fauna |
231. Birds | 232. Mammals | |
| 233. Insects | |||
| 234. Microfauna | |||
| 235. Endangered species | |||
| 236. Barriers | |||
| 237. Corridors | |||
| 240. Aquatic Fauna |
241. Fish and shellfish | 242. Benthic organisms | |
| 243. Microfauna | |||
| 244. Endangered species | |||
| 245. Barriers | |||
| 246. Corridors |
| (1) | (2) | (3) | (4) |
FACTORS • Existing • | 300. |
310. Land use |
311. Forests |
| 312. Grasslands | |||
| 313. Agriculture | |||
| 314. Rural | |||
| 315. Urban | |||
| 316. Mining | |||
| 317. Wilderness | |||
| 318. Wetlands | |||
| 320. Recreation |
321. Hunting | ||
| 322. Fishing | |||
| 323. Boating | |||
| 324. Swimming | |||
| 325. Camping and hiking | |||
| 326. Leisure | |||
| 330. Aesthetics |
331. Scenic views | ||
| 332. Wilderness qualities | |||
| 333. Open space qualities | |||
| 334. Unique physical features | |||
| 335. Unique species | |||
| 336. Unique ecosystems | |||
| 337. Natural reserves | |||
| 340. Historical |
341. Archaeological sites | ||
| 342. Historical sites | |||
| 343. Monuments | |||
| 350. Sociological |
351. Lifestyles | ||
| 352. Public health | |||
| 353. Employment | |||
| 354. Population density | |||
| 360. Anthropogenic |
361. Structures | ||
| 362. Transportation | |||
| 363. Commerce | |||
| 364. Utilities | |||
| 365. Water supply | |||
| 366. Wastewater management | |||
| 367. Solid waste management |
Each action listed in Table 35 is evaluated in terms of its effect on the environmental characteristics and conditions listed in Table 36. A slash (/) is placed diagonally from upper right to lower left across each block where significant interaction is expected.
A number between 1 and 10 is placed in the upper left-hand corner to indicate the relative magnitude of the impact (1 represents the least magnitude, and 10 the greatest). Likewise, a number between 1 and 10 is placed in the lower right-hand corner to indicate the relative importance of the impact. The rating scheme quantifies the Consultant's judgment regarding the probable impacts.
Table 37 shows the Leopold matrix for the EIA of the La Leche River flood control project. The discussion following this table focuses on the impacts for cases where one or both of the assigned magnitude/importance pairs is greater than 5 (labeled in red). More detailed discussion follows when the assigned magnitude/importance pair is greater than 7.
| Table 37. Application of the Leopold matrix. |
| Actions ⇒ ⇒ ⇒ | 11 | 12 | 13 | 14 | 15 | 21 | 22 | 23 | 24 | 31 | 32 | 33 | 41 | 42 | 43 | 51 | 52 | 53 | |
| Factors ⇓ ⇓ ⇓ | |||||||||||||||||||
| 100 | 111 | 8/8 | 0/0 | 0/0 | 0/0 | 0/0 | 0/0 | 0/0 | 0/0 | 0/0 | 0/0 | 0/0 | 0/0 | 0/0 | 0/0 | 0/0 | 0/0 | 0/0 | 0/0 |
| 112 | 8/8 | 2/2 | |||||||||||||||||
| 113 | 7/7 | ||||||||||||||||||
| 114 | 9/9 | ||||||||||||||||||
| 115 | 3/3 | 5/5 | 5/5 | 5/5 | 5/5 | 4/4 | |||||||||||||
| 116 | 6/6 | 5/5 | 5/5 | 5/5 | 5/5 | ||||||||||||||
| 121 | 5/5 | 5/5 | 2/2 | ||||||||||||||||
| 122 | 5/5 | 5/5 | |||||||||||||||||
| 123 | 2/2 | ||||||||||||||||||
| 124 | 2/2 | ||||||||||||||||||
| 125 | 2/2 | ||||||||||||||||||
| 126 | 7/7 | ||||||||||||||||||
| 127 | 1/1 | ||||||||||||||||||
| 128 | 3/3 | ||||||||||||||||||
| 131 | 5/5 | ||||||||||||||||||
| 132 | 5/5 | ||||||||||||||||||
| 133 | 1/1 | ||||||||||||||||||
| 134 | 2/2 | 2/2 | 7/7 | 5/5 | 5/5 | 5/5 | 5/5 | 5/5 | 5/5 | 5/5 | 5/5 | 5/5 | |||||||
| Actions ⇒ ⇒ ⇒ | 11 | 12 | 13 | 14 | 15 | 21 | 22 | 23 | 24 | 31 | 32 | 33 | 41 | 42 | 43 | 51 | 52 | 53 | |
| Factors ⇓ ⇓ ⇓ | |||||||||||||||||||
| 200 | 211 | 2/2 | 0/0 | 0/0 | 0/0 | 0/0 | 0/0 | 0/0 | 0/0 | 0/0 | 0/0 | 0/0 | 0/0 | 0/0 | 0/0 | 0/0 | 0/0 | 0/0 | 0/0 |
| 212 | 2/2 | ||||||||||||||||||
| 213 | 2/2 | ||||||||||||||||||
| 214 | 8/8 | ||||||||||||||||||
| 215 | |||||||||||||||||||
| 216 | |||||||||||||||||||
| 221 | 5/5 | ||||||||||||||||||
| 222 | 1/1 | ||||||||||||||||||
| 231 | |||||||||||||||||||
| 232 | |||||||||||||||||||
| 233 | |||||||||||||||||||
| 234 | |||||||||||||||||||
| 235 | |||||||||||||||||||
| 236 | |||||||||||||||||||
| 237 | 5/5 | 5/5 | 5/5 | ||||||||||||||||
| 241 | |||||||||||||||||||
| 242 | |||||||||||||||||||
| 243 | |||||||||||||||||||
| 244 | |||||||||||||||||||
| 245 | 4/4 | ||||||||||||||||||
| 246 | 7/7 | 5/5 | 5/5 | ||||||||||||||||
| Actions ⇒ ⇒ ⇒ | 11 | 12 | 13 | 14 | 15 | 21 | 22 | 23 | 24 | 31 | 32 | 33 | 41 | 42 | 43 | 51 | 52 | 53 | |
| Factors ⇓ ⇓ ⇓ | |||||||||||||||||||
| 300 | 311 | 0/0 | 0/0 | 0/0 | 0/0 | 0/0 | 0/0 | 0/0 | 0/0 | 0/0 | 0/0 | 0/0 | 0/0 | 0/0 | 0/0 | 0/0 | 0/0 | 0/0 | 0/0 |
| 312 | 7/7 | ||||||||||||||||||
| 313 | 8/8 | ||||||||||||||||||
| 314 | |||||||||||||||||||
| 315 | |||||||||||||||||||
| 316 | |||||||||||||||||||
| 317 | |||||||||||||||||||
| 318 | 1/1 | ||||||||||||||||||
| 321 | 2/2 | ||||||||||||||||||
| 322 | 7/7 | ||||||||||||||||||
| 323 | 7/7 | ||||||||||||||||||
| 324 | 7/7 | ||||||||||||||||||
| 325 | 7/7 | ||||||||||||||||||
| 326 | 7/7 | ||||||||||||||||||
| 331 | 5/5 | ||||||||||||||||||
| 332 | 2/2 | ||||||||||||||||||
| 333 | 4/4 | ||||||||||||||||||
| 334 | 4/4 | ||||||||||||||||||
| 335 | |||||||||||||||||||
| 336 | |||||||||||||||||||
| 337 | 5/5 | ||||||||||||||||||
| 341 | 2/2 | ||||||||||||||||||
| 342 | 1/1 | ||||||||||||||||||
| 343 | |||||||||||||||||||
| 351 | 3/3 | ||||||||||||||||||
| 352 | 1/1 | ||||||||||||||||||
| 353 | 5/5 | ||||||||||||||||||
| 354 | 2/2 | ||||||||||||||||||
| 361 | 9/9 | 4/4 | |||||||||||||||||
| 362 | 2/2 | 7/7 | 3/3 | ||||||||||||||||
| 363 | 5/5 | 5/5 | 2/2 | ||||||||||||||||
| 364 | 2/2 | 6/6 | |||||||||||||||||
| 365 | 7/7 | 5/5 | |||||||||||||||||
| 366 | 1/1 | ||||||||||||||||||
| 367 | 1/1 | ||||||||||||||||||
The following actions are identified as crucial to the environmental impact assessment: (1) dams/reservoirs [1], (2) canals [3], (3) access roads [5], (4) dam failure [51], and (5) explosions [53]. The twenty (20) entries with red scores are discussed below.
Impact of dams/reservoirs on soils [11,111]: Dams will retain sands and silts, and will reduce the amount of sediments being deposited in the flood plain.
Impact of dams/reservoirs on soil moisture [11,112]: Dams will retain water, which will be made available for irrigation, increasing soil moisture during dry periods.
Impact of dams/reservoirs on albedo [11,113]: Dams will lower the albedo in the vicinity, causing changes in the near-ground air thermal balance. This changes have the effect of increasing local rainfall (Ponce et al., 1997).
Impact of dams/reservoirs on nutrients [11,114]: Dams will retain sediments and, therefore, the nutrients that are embedded in the sediments. Nutrient replenishment in the flood plain will be diminished.
Impact of dams/reservoirs on fossils [11,116]: Reservoirs will flood the land and destroy, or make unavailable, the fossil remains.
Impact of dams on salinity [11,128]: Dams and reservoirs will increase the ratio of evapotranspiration to runoff. The reduced runoff will cause an increase in the concentration of total dissolved solids, i.e., an increase in salinity.
Impact of dams/reservoirs on crops [11,214]: Dams will have two effects on crops. The crops inundated by the reservoir(s) will be lost. However, the dam(s) will store water to irrigate downstream valley lands, with a substantial increase in total land surface area under production.
Impact of dams/reservoirs on corridors [11,246]: Dams may inhibit wildlife corridors.
Impact of dams/reservoirs on rural land [11,312]: Reservoirs may flood substantial portions of the land, which currently may be dedicated to grassland. This is particularly the case of Calicantro dam.
Impact of dams/reservoirs on agriculture [11,313]: Reservoirs may flood substantial portions of the land, which currently may be dedicated to agriculture. This is particularly the case of La Calzada dam.
Impact of dams/reservoirs on fishing [11,322]: Fishing will be possible on the reservoirs created by La Calzada and Calicantro dams.
Impact of dams/reservoirs on boating [11,323]: Boating will be possible on the reservoirs created by La Calzada and Calicantro dams.
Impact of dams/reservoirs on swimming [11,324]: Swimming will be possible on the reservoirs created by La Calzada and Calicantro dams.
Impact of dams/reservoirs on camping and hiking [11,325]: Camping and hiking will be possible on the reservoirs created by La Calzada and Calicantro dams.
Impact of dams/reservoirs on leisure [11,326]: Leisure activities will be possible on the reservoirs created by La Calzada and Calicantro dams.
Impact of dams/reservoirs on water supply [11,365]: Dams will increase the water supply available for irrigation and domestic uses.
Impact of blasting and drilling on air quality during construction [21,134]: Blasting and drilling will cause a moderate impact to air quality during construction.
Impact of dam failure on structures [51,361]: Dam failure will cause catastrophic damage to structures.
Impact of dam failure on transportation [51,362]: Dam failure will cause severe damage to transportation infrastructure.
Impact of dam failure on public services [51,364]: Dam failure will cause severe damage to utility infrastructure.
The six (6) entries with scores greater than or equal to 8 in Table 37 are further discussed below.
Impact of dams on soils [11,111] (score 8/8): Dams will retain sands and silts. This will cause degradation of the downstream reach of the La Leche river, as clear water is released from the dam. The degradation effect will be diminished with appropriate sediment management at the damsite. The sediment retained in the dams will not reach the flood plain.
Impact of dams on soil moisture [11,112] (score 8/8): Dams will retain water. This retention will change the natural distribution of precipitation. More water will go into soil moisture, and therefore, into evapotranspiration. Less water will go into runoff.
Impact of dams on nutrients [11,114] (score 9/9): The reservoirs will hold sands and silts, and therefore, retain the nutrients that are embedded in the sediments. These nutrients will be sequestered and unavailable for use by plants.
Impact of dams on crops [11,214] (score 8/8): The crops inundated by the reservoirs, particularly at La Calzada, will be lost. The inundated areas can be replaced by irrigated areas downstream, but the physical, chemical, and biological setting is not likely to be the same.
Impact of dams on agriculture [11,313] (score 8/8): Substantial portions of the land, which currently are dedicated to agriculture, will be rendered inoperable by the flooding of the reservoir. This is particularly the case of La Calzada dam.
Impact of dam failure on structures [51,361] (score 9/9): Dam failure will cause catastrophic damage to structures. The dam/reservoir should be designed with maximum security criteria. The emergency spillway(s) must be able to pass the Probable Maximum Flood in a safe manner, without overtopping the dam.
9.2 Application of the Battelle Environmental Evaluation System
The Battelle Environmental Evaluation System (EES) is based on a classification consisting of four levels (Appendix II):
- Level I: Categories,
- Level II: Components,
- Level III: Parameters, and
- Level IV: Measurements.
Each category (Level I) is divided into several components, each component (Level II) into several parameters, and each parameter (Level III) into one or more measurements. The EES identifies a total of four (4) categories, eighteen (18) components and seventy-eight (78) parameters.
Table 38 shows the complete list of categories, components, and parameters. Column 1 shows the four (4) categories, Column 2 shows the eighteen (18) components, and Column 3 shows the seventy-eight (78) parameters. The parameters labeled in red are most relevant for the present study.
The EES methodology is based on the assignment of "parameter importance units" (PIU). A total of 1000 PIUs is distributed among the 78 parameters based on value judgments. The individual PIUs are shown in Column 4 of Table 38. Effectively, for each parameter i its (PIU)i represents a weight wi.
| Table 38. Categories, components, and parameters of the Battelle EES. |
| (1) | (2) | (3) | (4) |
| Categories | Components | Parameters | PIUi (wi) |
Ecology |
Species |
1. Terrestrial browsers and grazers | 14 |
| 2. Terrestrial crops | 14 | ||
| 3. Terrestrial natural vegetation | 14 | ||
| 4. Terrestrial pest species | 14 | ||
| 5. Terrestrial upland game birds | 14 | ||
| 6. Aquatic commercial fisheries | 14 | ||
| 7. Aquatic natural vegetation | 14 | ||
| 8. Aquatic pest species | 14 | ||
| 9. Sport fish | 14 | ||
| 10. Waterfowl | 14 | ||
Habitats |
11. Terrestrial food web index | 12 | |
| 12. Land use | 12 | ||
| 13. Terrestrial rare and endangered species | 12 | ||
| 14. Terrestrial species diversity | 14 | ||
| 15. Aquatic food web index | 12 | ||
| 16. Aquatic rare and endangered species | 12 | ||
| 17. River characteristics | 12 | ||
| 18. Aquatic species diversity | 14 |
| (1) | (2) | (3) | (4) |
| Categories | Components | Parameters | PIUi (wi) |
Pollution |
Water |
19. Basin hydrologic loss | 20 |
| 20. BOD | 25 | ||
| 21. Dissolved Oxygen | 31 | ||
| 22. Fecal coliforms | 18 | ||
| 23. Inorganic carbon | 22 | ||
| 24. Inorganic nitrogen | 25 | ||
| 25. Inorganic phosphate | 28 | ||
| 26. Pesticides | 16 | ||
| 27. pH | 18 | ||
| 28. Stream flow variation | 28 | ||
| 29. Temperature | 28 | ||
| 30. TDS | 25 | ||
| 31. Toxic substances | 14 | ||
| 32. Turbidity | 20 | ||
Air |
33. Carbon monoxide | 5 | |
| 34. Hydrocarbons | 5 | ||
| 35. Nitrogen oxides | 10 | ||
| 36. Particulate matter | 12 | ||
| 37. Photochemical oxidants | 5 | ||
| 38. Sulfur dioxide | 10 | ||
| 39. Other | 5 | ||
Land |
40. Land use | 14 | |
| 41. Soil erosion | 14 | ||
| Noise | 42. Noise | 4 |
| (1) | (2) | (3) | (4) |
| Categories | Components | Parameters | PIUi (wi) |
Aesthetics |
Land |
43. Geologic surface material | 6 |
| 44. Relief and topographic character | 16 | ||
| 45. Width and alignment | 10 | ||
Air |
46. Odor and visual quality | 3 | |
| 47. Sounds | 2 | ||
Water |
48. Appearance | 10 | |
| 49. Land and water interface | 16 | ||
| 50. Odor and floating materials | 6 | ||
| 51. Water surface area | 10 | ||
| 52. Wooded and geologic shoreline | 10 | ||
Biota |
53. Animals - domestic | 5 | |
| 54. Animals - wild | 5 | ||
| 55. Diversity of vegetation types | 9 | ||
| 56. Variety within vegetation types | 5 | ||
| Manmade objects | 57. Manmade objects | 10 | |
Composition |
58. Composite effect | 15 | |
| 59. Unique composition | 15 |
| (1) | (2) | (3) | (4) |
| Categories | Components | Parameters | PIUi (wi) |
Human |
Educational/ scientific packages |
60. Archaeological | 13 |
| 61. Ecological | 13 | ||
| 62. Geological | 11 | ||
| 63. Hydrological | 11 | ||
Historical packages |
64. Architecture and styles | 11 | |
| 65. Events | 11 | ||
| 66. Persons | 11 | ||
| 67. Religions and cultures | 11 | ||
| 68. Western frontier | 11 | ||
Cultures |
69. Indians | 14 | |
| 70. Other ethnic groups | 7 | ||
| 71. Religious groups | 7 | ||
Mood/ atmosphere |
72. Awe-inspiration | 11 | |
| 73. Isolation/solitude | 11 | ||
| 74. Mystery | 4 | ||
| 75. Oneness with nature | 11 | ||
Life |
76. Employment opportunities | 13 | |
| 77. Housing | 13 | ||
| 78. Social interactions | 11 |
Each (PIU)i or wi requires a specific measurement or assessment. The methodology converts these measurements into common units by means of a scalar or "value function." A scalar has a measurement in the x-axis, and a common environmental quality scale or "value" in the y-axis. The latter varies in the range 0 ≤ Vi ≤ 1. A value of Vi = 0 indicates very poor quality, while Vi = 1 indicates very good quality. Values of Vi = Vi,0 are obtained for conditions 'without' the project, and Vi = Vi,1 for conditions 'with' the project. The condition 'without' the project represents the current condition, while that 'with' the project represents the predicted future condition (see Appendix II).
The environmental impact EI of the project is evaluated as the difference between 'with' and without' conditions:
| EI = ∑ [ Vi,1 wi ] - ∑ [ Vi,0 wi ] | (1) |
Since the weights are the same for conditions 'with' and 'without' the project:
| EI = wi ∑ [ Vi,1 - Vi,0 ] | (2) |
Defining the impact value as:
| ΔVi = Vi,1 - Vi,0 | (3) |
Then:
| EI = ∑ [ wi ΔVi ] | (4) |
for i = 1 to n, where n = number of parameters (78).
For EI > 0, the situation 'with' the project is better than 'without' the project, indicating that the project has positive environmental benefits. Conversely, for EI < 0, the situation 'with' the project is worse than 'without' the project, indicating that the project has negative environmental benefits, i.e., certain negative impacts. A large negative value of EI indicates the existence of substantial negative impacts.
Table 39 shows the application of the Battelle EES. Columns 1-4 are the same as in Table 38. Column 5 is Vi,0; Col. 6 is Vi,1; Col. 7 is ΔVi; and Col. 8 is wi ΔVi. The value-function estimates are described in Appendix III. Table 39 shows that the environmental impact EI = -26.3. This value is 2.63% of the total parameter allocation, which is 1000 (see Table 1 of Appendix II). This percentage represents the change in environmental quality with project implementation. Since the value is negative, there will be a cumulative negative impact. However, the value is small and manageable with an appropriate mitigation plan in place.
| Table 39. Application of the Battelle Environmental Evaluation System (EES). |
| (1) | (2) | (3) | (4) | (5) | (6) | (7) | (8) |
| Categories | Components | Parameters | wi | Vi,0 | Vi,1 | ΔVi | wi ΔVi |
Ecology |
Species |
1. Terrestrial browsers and grazers | 14 | 1.0 | 0.7 | -0.3 | -4.2 |
| 2. Terrestrial crops | 14 | 0.7 | 0.9 | 0.2 | 2.8 | ||
| 3. Terrestrial natural vegetation | 14 | 1.0 | 0.7 | -0.3 | -4.2 | ||
| 4. Terrestrial pest species | 14 | 1.0 | 1.0 | 0 | 0 | ||
| 5. Terrestrial upland game birds | 14 | 0.7 | 1.0 | 0.3 | 4.2 | ||
| 6. Aquatic commercial fisheries | 14 | 0.0 | 0.3 | 0.3 | 4.2 | ||
| 7. Aquatic natural vegetation | 14 | 0.2 | 0.5 | 0.3 | 4.2 | ||
| 8. Aquatic pest species | 14 | 1.0 | 1.0 | 0 | 0 | ||
| 9. Sport fish | 14 | 0.2 | 0.8 | 0.6 | 8.4 | ||
| 10. Waterfowl | 14 | 0.5 | 1.0 | 0.5 | 7.0 | ||
Habitats |
11. Terrestrial food web index | 12 | 1.0 | 1.0 | 0 | 0 | |
| 12. Land use | 12 | 0.8 | 0.0 | -0.8 | -9.6 | ||
| 13. Terrestrial rare and endangered species | 12 | 1.0 | 1.0 | 0 | 0 | ||
| 14. Terrestrial species diversity | 14 | 1.0 | 1.0 | 0 | 0 | ||
| 15. Aquatic food web index | 12 | 0.2 | 0.8 | 0.6 | 7.2 | ||
| 16. Aquatic rare and endangered species | 12 | 1.0 | 1.0 | 0 | 0 | ||
| 17. River characteristics | 12 | 1.0 | 0.0 | -1.0 | -12.0 | ||
| 18. Aquatic species diversity | 14 | 0.2 | 0.8 | 0.6 | 8.4 |
| (1) | (2) | (3) | (4) | (5) | (6) | (7) | (8) |
| Categories | Components | Parameters | wi | Vi,0 | Vi,1 | ΔVi | wi ΔVi |
Pollution |
Water |
19. Basin hydrologic loss | 20 | 1.0 | 0.2 | -0.8 | -16.0 |
| 20. BOD | 25 | 1.0 | 0.9 | -0.1 | -2.5 | ||
| 21. Dissolved Oxygen | 31 | 1.0 | 0.9 | -0.1 | -3.1 | ||
| 22. Fecal coliforms | 18 | 1.0 | 1.0 | 0 | 0 | ||
| 23. Inorganic carbon | 22 | 1.0 | 1.0 | 0 | 0 | ||
| 24. Inorganic nitrogen | 25 | 1.0 | 1.0 | 0 | 0 | ||
| 25. Inorganic phosphate | 28 | 1.0 | 1.0 | 0 | 0 | ||
| 26. Pesticides | 16 | 1.0 | 0.9 | -0.1 | -1.6 | ||
| 27. pH | 18 | 1.0 | 1.0 | 0 | 0 | ||
| 28. Stream flow variation | 28 | 1.0 | 0.2 | -0.8 | -22.4 | ||
| 29. Temperature | 28 | 1.0 | 0.6 | -0.4 | -11.2 | ||
| 30. TDS | 25 | 1.0 | 0.7 | -0.3 | -7.5 | ||
| 31. Toxic substances | 14 | 1.0 | 1.0 | 0 | 0 | ||
| 32. Turbidity | 20 | 1.0 | 1.0 | 0 | 0 | ||
Air |
33. Carbon monoxide | 5 | 1.0 | 1.0 | 0 | 0 | |
| 34. Hydrocarbons | 5 | 1.0 | 1.0 | 0 | 0 | ||
| 35. Nitrogen oxides | 10 | 1.0 | 1.0 | 0 | 0 | ||
| 36. Particulate matter | 12 | 1.0 | 0.9 | -0.1 | -1.2 | ||
| 37. Photochemical oxidants | 5 | 1.0 | 1.0 | 0 | 0 | ||
| 38. Sulfur dioxide | 10 | 1.0 | 1.0 | 0 | 0 | ||
| 39. Other | 5 | 1.0 | 1.0 | 0 | 0 | ||
Land |
40. Land use | 14 | 1.0 | 0.9 | -0.1 | -1.4 | |
| 41. Soil erosion | 14 | 1.0 | 0.8 | -0.2 | -2.8 | ||
| Noise | 42. Noise | 4 | 1.0 | 0.8 | -0.2 | -0.8 |
| (1) | (2) | (3) | (4) | (5) | (6) | (7) | (8) |
| Categories | Components | Parameters | wi | Vi,0 | Vi,1 | ΔVi | wi ΔVi |
Aesthetics |
Land |
43. Geologic surface material | 6 | 1.0 | 1.0 | 0 | 0 |
| 44. Relief and topographic character | 16 | 1.0 | 1.0 | 0 | 0 | ||
| 45. Width and alignment | 10 | 1.0 | 0.8 | -0.2 | -2.0 | ||
Air |
46. Odor and visual quality | 3 | 0.6 | 0.6 | 0 | 0 | |
| 47. Sounds | 2 | 1.0 | 1.0 | 0 | 0 | ||
Water |
48. Appearance | 10 | 0.1 | 1.0 | 0.9 | 9.0 | |
| 49. Land and water interface | 16 | 1.0 | 0.9 | -0.1 | -1.6 | ||
| 50. Odor and floating materials | 6 | 1.0 | 0.9 | -0.1 | -0.6 | ||
| 51. Water surface area | 10 | 0.1 | 1.0 | 0.9 | 9.0 | ||
| 52. Wooded and geologic shoreline | 10 | 0.1 | 1.0 | 0.9 | 9.0 | ||
Biota |
53. Animals - domestic | 5 | 1.0 | 1.0 | 0 | 0 | |
| 54. Animals - wild | 5 | 1.0 | 1.0 | 0 | 0 | ||
| 55. Diversity of vegetation types | 9 | 1.0 | 0.8 | -0.2 | -1.8 | ||
| 56. Variety within vegetation types | 5 | 1.0 | 0.8 | -0.2 | -1.0 | ||
| Manmade objects | 57. Manmade objects | 10 | 1.0 | 0.8 | -0.2 | -2.0 | |
Composition |
58. Composite effect | 15 | 0.7 | 1.0 | 0.3 | 4.5 | |
| 59. Unique composition | 15 | 1.0 | 0.9 | -0.1 | -1.5 |
| (1) | (2) | (3) | (4) | (5) | (6) | (7) | (8) |
| Categories | Components | Parameters | wi | Vi,0 | Vi,1 | ΔVi | wi ΔVi |
Human |
Educational/ |
60. Archaeological | 13 | 1.0 | 0.9 | -0.1 | -1.3 |
| 61. Ecological | 13 | 1.0 | 1.0 | 0 | 0 | ||
| 62. Geological | 11 | 1.0 | 0.8 | -0.2 | -2.2 | ||
| 63. Hydrological | 11 | 1.0 | 1.0 | 0 | 0 | ||
Historical |
64. Architecture and styles | 11 | 1.0 | 1.0 | 0 | 0 | |
| 65. Events | 11 | 1.0 | 1.0 | 0 | 0 | ||
| 66. Persons | 11 | 1.0 | 1.0 | 0 | 0 | ||
| 67. Religions and cultures | 11 | 1.0 | 1.0 | 0 | 0 | ||
| 68. Western frontier | 11 | 1.0 | 1.0 | 0 | 0 | ||
Cultures |
69. Indians | 14 | 1.0 | 1.0 | 0 | 0 | |
| 70. Other ethnic groups | 7 | 1.0 | 1.0 | 0 | 0 | ||
| 71. Religious groups | 7 | 1.0 | 1.0 | 0 | 0 | ||
Mood/ |
72. Awe-inspiration | 11 | 1.0 | 1.0 | 0 | 0 | |
| 73. Isolation/solitude | 11 | 1.0 | 1.0 | 0 | 0 | ||
| 74. Mystery | 4 | 1.0 | 1.0 | 0 | 0 | ||
| 75. Oneness with nature | 11 | 1.0 | 1.0 | 0 | 0 | ||
Life |
76. Employment opportunities | 13 | 0.3 | 1.0 | 0.7 | 9.1 | |
| 77. Housing | 13 | 1.0 | 0.5 | -0.5 | -6.5 | ||
| 78. Social interactions | 11 | 0.3 | 1.0 | 0.7 | 7.7 | ||
| The Battelle EES Environmental Impact Analysis Cumulative Index EI ⇒ | -26.3 | ||||||
In the Battelle EES, the potential problem areas are represented by those parameters for which the Vi value changes significantly in the adverse direction, as measured by the following relation (negative values, in percent):
| ΔVi,r = 100 (Vi,1 - Vi,0) / Vi,0 | (5) |
These parameters are tagged with 'red flags' to indicate potential problems which may warrant more detailed attention. For parameters in the ecology category, a minor red flag applies when 5% < ΔVi,r ≤ 10%, and a major red flag when ΔVi,r > 10 %. In all other categories, a minor red flag applies when ΔVi,r ≤ 30% or ΔVi ≤ 0.1, and a major red flag when ΔVi,r > 30% or ΔVi > 0.1.
Table 40 identifies the red flags associated with substantially negative impacts of the project. A total of sixteen (16) major red flags are identified.
| Table 40. Identification of red flags. |
| (1) | (2) | (3) | (4) | (5) | (6) | (7) |
| Parameters | wi | Vi,0 | Vi,1 | ΔVi | ΔVi,r | Red flag |
| 1. Terrestrial browsers and grazers | 14 | 1.0 | 0.7 | -0.3 | -30 | Major |
| 3. Terrestrial natural vegetation | 14 | 1.0 | 0.7 | -0.3 | -30 | Major |
| 12. Land use | 12 | 0.8 | 0.0 | -0.8 | -100 | Major |
| 17. River characteristics | 12 | 1.0 | 0.0 | -1.0 | -100 | Major |
| 19. Basin hydrologic loss | 20 | 1.0 | 0.2 | -0.8 | -80 | Major |
| 20. BOD | 25 | 1.0 | 0.9 | -0.1 | -10 | Minor |
| 21. Dissolved Oxygen | 31 | 1.0 | 0.9 | -0.1 | -10 | Minor |
| 26. Pesticides | 16 | 1.0 | 0.9 | -0.1 | -10 | Minor |
| 28. Stream flow variation | 28 | 1.0 | 0.2 | -0.8 | -80 | Major |
| 29. Temperature | 28 | 1.0 | 0.6 | -0.4 | -40 | Major |
| 30. TDS | 25 | 1.0 | 0.7 | -0.3 | -30 | Major |
| 36. Particulate matter | 12 | 1.0 | 0.9 | -0.1 | -10 | Minor |
| 40. Land use | 14 | 1.0 | 0.9 | -0.1 | -10 | Minor |
| 41. Soil erosion | 14 | 1.0 | 0.8 | -0.2 | -20 | Major |
| 42. Noise | 4 | 1.0 | 0.8 | -0.2 | -20 | Major |
| 45. Width and alignment | 10 | 1.0 | 0.8 | -0.2 | -20 | Major |
| 49. Land and water interface | 16 | 1.0 | 0.9 | -0.1 | -10 | Minor |
| 50. Odor and floating materials | 6 | 1.0 | 0.9 | -0.1 | -10 | Minor |
| 55. Diversity of vegetation types | 9 | 1.0 | 0.8 | -0.2 | -20 | Major |
| 56. Variety within vegetation types | 5 | 1.0 | 0.8 | -0.2 | -20 | Major |
| 57. Manmade objects | 10 | 1.0 | 0.8 | -0.2 | -20 | Major |
| 59. Unique composition | 15 | 1.0 | 0.9 | -0.1 | -10 | Minor |
| 60. Archaeological | 13 | 1.0 | 0.9 | -0.1 | -10 | Minor |
| 62. Geological | 11 | 1.0 | 0.8 | -0.2 | -20 | Major |
| 77. Housing | 13 | 1.0 | 0.5 | -0.5 | -50 | Major |