|
|
FLOOD HYDROLOGY
OF THE BINATIONAL COTTONWOOD CREEK - ARROYO ALAMAR, CALIFORNIA AND BAJA CALIFORNIA Victor Miguel Ponce
San Diego State University |
|
|
|
FLOOD HYDROLOGY
OF THE BINATIONAL COTTONWOOD CREEK - ARROYO ALAMAR, CALIFORNIA AND BAJA CALIFORNIA Victor Miguel Ponce
San Diego State University |
| Web version 1.05 [050509] |
|
|
|
|
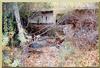
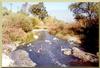
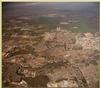
| Cottonwood Creek (40114) in the vicinity of the border with Mexico. |
|
Data Management Results Conclusions References Appendices |
|
INTRODUCTION
This report describes the flood hydrology study
of Alamar Creek (Arroyo Alamar), located in the city of Tijuana, Baja California, Mexico.
The Alamar Creek is being considered for development by the Instituto
Municipal de Planeacion (IMPlan), of the Municipality of Tijuana.
The project entails the river channel improvement from the intersection
with the toll road to Tecate (Mexico 2) to
its confluence with the Tijuana River, in the city of Tijuana.
The length of the channel improvement project is 10 km.
The watershed of Alamar Creek is part of the Tijuana River basin,
which flows into to the Pacific Ocean at Imperial Beach, in the County of San Diego,
California. The Tijuana River basin encompasses the
County of San Diego and the municipalities of Tijuana, Rosarito and Tecate,
in Baja California. It is effectively a binational watershed,
with the major portion (70 percent) in Baja California and the remainder
in California (Comision Nacional del Agua, 1994). Therefore,
the flood hydrology study comprises the analysis of geographical, geological,
climatological, and hydrologic data on both sides of the border.
The Alamar Creek watershed is part of the
Cottonwood Creek- Alamar Creek- Tijuana River basin system. It is comprised
within 32o 30' and 32o 56'
North latitude and
116o 18' and 116o 57' West longitude,
with the major portion (86.2 percent) in California,
and the remainder (13.8 percent) in Baja California. The flood hydrology
study comprises the analysis of Cottonwood Creek (the main stream)
and its major tributaries: Kitchen, La Posta,
Morena, Pine Valley, Potrero and Campo-Tecate, among others.
Cottonwood Creek takes the name of Tijuana River at its confluence with Tecate Creek,
inside California, and later changes its name to Arroyo Alamar as it enters Mexico.
Downstream, in the city of Tijuana proper,
Arroyo Alamar joins with the Tijuana River,
which then crosses the border and flows into the ocean at Imperial Beach.
This study focuses on the flood hydrology of Cottonwood Creek - Arroyo Alamar.
The objective is to determine the flood flows associated with return periods
of 2 to 1000 yr. The analysis has been performed using
a deterministic-conceptual model of event rainfall-runoff, of general applicability.
In current hydrologic practice, this type of
analysis is preferred to that based on parametric or statistical models.
The latter require a long period of record, comparable to the predictive horizon
(up to 1000 yr), which is not available for Alamar Creek.
BACKGROUND The Comision Nacional del Agua, through its State Office in Baja California, Water Administration Section, has performed the study entitled "Alamar Creek Watershed, Tijuana, B.C., Hydrology Study" (Comision Nacional del Agua, 1993). The objective of this study is to analyze the hydrologic conditions of the Alamar Creek watershed, to determine flood frequency and to calculate the flood discharge of the "free basin". The "free basin" is the downstream portion of the basin, which is not subject to regulation by Morena and Barrett Dams, located within the United States and out of the control of Mexico. The cited study used data for the 14-yr period corresponding to 1979-1992 in the gaging station located on Arroyo Alamar. This was for the purpose of determining the design discharge to use in the delineation of the federal zone. The study utilized the following statistical methods: (1) Gumbel, (2) Gumbel two populations (II), and (3) normal distribution. The calculated design discharges, for return periods from 5 to 10000 yr, are shown for reference on lines 1 to 3 of Table B-1 . The analysis concluded that the normal distribution was more representative of the gaged data, and its values were adopted for design. The cited study also considers the design discharge used for the existing channelization in Arroyo Alamar, immediately upstream of its confluence with the Tijuana River, which is 1720 m3/s. This channelization is a trapezoidal section of lined concrete, with a length of 1.8 km, and was constructed as part of the first phase of the channelization of the Tijuana River, completed in 1970. The study mentions that the emergency spillway of Barrett Dam, located upstream of the Alamar Creek, entirely within the United States, is designed for a discharge of 1698.6 m3/s. For the delineation of the federal zone, the cited study (Comision Nacional del Agua, 1993) calculates a design discharge of 801.21 m3/s, which is comprised of two parts:
The ratio of discharges (551.0 m3/s / 801.21 m3/s) was calculated from the ratio of drainage areas, taken as 75,864 ha for the "free basin" and 110,314 ha for the whole basin. The difference between these two values is 34,450 ha, which corresponds to the tributary area of Barrett Dam, excluding that of Morena Dam. The study cited mentions that the discharge to use for the delineation of the federal zone is either the one calculated (801.21 m3/s) or the capacity of the natural channel, whichever is greater. A similar study was commissioned by the Regional Technical Section, Regional Directorate of the Peninsula of Baja California, Comision Nacional del Agua, the following year (Comision Nacional del Agua, 1994). This study used gaged measurements for the 15-yr period 1979-93, and this time concluded that the Gumbel II method was the most representative one of the data measured, with the results shown in line 4 of Table B-1 . According to regulations established by the National Water Commission, the cited study determined that the discharge to be used in the delineation of the federal zone of Alamar Creek will have a return period of 10 yr, which corresponds to a design discharge of 548 m3/s, i.e., 550 m3/s. The difference between these two studies, for the same purposes, is marked. The first study assumes the normal distribution as valid, a return period of 50 yr, and considers that a fraction of the total discharge, calculated by means of a ratio of tributary areas, is spilled from Barrett Dam. The second study considers the Gumbel II distribution as valid, a return period of 10 yr, and does not consider the spilling of Barrett Dam. It should be mentioned that the federal regulation for the delineation of federal zones establishes a return period (a) of 5 yr in semiarid to humid regions, or (b) greater than or equal to 10 yr in arid regions with occasional runoff (ephemeral streams). This last value is applicable to the basin of Alamar Creek.
DESCRIPTION OF THE BASIN
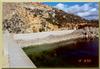
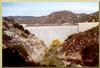
Alamar Creek originates in the United States with the name of Cottonwood Creek, with its headwaters near Elev. 1646 m in the vicinity of Crouch Valley, southwest of Mount Laguna, in East San Diego County. Cottonwood Creek flows to the South toward Mexico, and it is joined by several tributaries, among them, from upstream to downstream: Kitchen, La Posta, Morena, Hauser, Pine Valley, Corral Canyon, Wilson, Rattlesnake Canyon, McAlmond Canyon, Potrero, Bee Canyon, Campo-Tecate, and Mine Canyon. Morena and Barrett dams, located in Cottonwood Creek, form part of the system of reservoirs of the City of San Diego. Morena Dam is located downstream of the confluence of Cottonwood Creek with Morena Creek and upstream of Hauser Creek. Barrett Dam is located downstream of Pine Valley Creek, Corral Canyon and Wilson Creek, and upstream of Rattlesnake Canyon. Morena Dam is geographically located at 32o 41' North latitude and 116o 32' 55" West longitude. The height of the dam, measured above the streambed, is 52.12 m, and the length and width of the crest is 167.64 m and 6.096 m, respectively. The emergency spillway is of ogee type without control, with a length of 95.098 m, and a capacity of 707.92 m3/s at the dam crest elevation. Morena dam was put into operation in 1912. The emergency spillway operated in the years 1916, 1917, 1927, 1928, 1939-44, and 1980-84. Barrett Dam is located at 32o 40' 45" North latitude and 116o 40' 20" West longitude. The height of the dam, measured above the streambed, is 52.12 m, and the length and width of the crest is 227.381 and 4.572 m, respectively. The emergency spillway is of ogee type, controlled with 26 floodgates each 2.438 m in height and 3.941 m wide, with a total length of 102.467 m. The capacity of the emergency spillway is 2491.88 m3/s at the level of the 2.438-m vertical wall on top of the dam crest. The dam was put into operation in 1922. The spillway operated in the years 1927, 1937, 1938, 1939, 1941-43, 1979-84, 1993, 1994, 1995, and 1998. (The data for Morena and Barrett Dams was provided by the City of San Diego's Water Department, and converted to metric units for the purpose of this study). The City of San Diego operates Morena and Barrett Dams mainly for water supply purposes. Therefore, the objective is to retain the greatest possible quantity of water. The operation of these reservoirs for flood control purposes is not well defined, although it is apparently effective. Partly for this purpose, Barrett Dam is operated with the gates open during the rainy season (November 1 to April 1). The water levels of Morena Dam (see Data Management section) corresponding to the period 1912-2000 show a mean mean monthly level (MMLmean) = 120.09 ft and a maximum mean monthly level (MMLmax) = 122.50 ft. These levels can be compared with the crest level, which is 157 ft. The difference 157.0 - 120.09 = 36.91 ft (11.25 m) indicates that Morena Dam is operated well below the crest of the overflow spillway. The difference 122.5 - 120.09 = 2.41 ft (0.734 m) indicates that Morena dam is operated with very little seasonal variation. The water levels of Barrett Dam (see Data Management section) corresponding to the period 1921-2000 show a mean mean monthly level (MMLmean) = 115.42 ft and a maximum mean monthly level (MMLmax) = 121.60 ft. These levels can be compared with the crest level, which is 160.9 ft. The difference 160.9 - 115.42 = 45.48 ft (13.86 m) indicates that Barrett Dam is operated well below the crest of the overflow spillway. The difference 121.6 - 115.42 = 6.18 ft (1.883 m) indicates that Barrett dam is operated with very little seasonal variation This analysis supports the conclusion that the operating level of Morena and Barrett dams is more dependent on multiannual than annual hydrologic tendencies (meteorological droughts as opposed to season variations). Cottonwood Creek flows downstream of Lake Barrett in a southwestern direction, toward Mexico, receiving the contributions of the tributaries Rattlesnake, McAlmond, Potrero, Bee Canyon, Campo-Tecate and Mine Canyon. After receiving the waters of Tecate Creek, within U.S. territory, Cottonwood Creek changes its name to Tijuana river. However, as this river enters Mexican territory, it again changes name to Arroyo Alamar, which flows in a western direction toward the city of Tijuana, joining the Tijuana River after aproximately 16 km. The contributing watershed of Arroyo Alamar, in its confluence with the Tijuana river, is 1387 km2 (see Data Management section). Of this area, 1196 km2 (86.2 percent) is in California and 191 km2 (13.8 percent) in Baja California.
METHODOLOGY
The methodology for the flood hydrology study of Alamar Creek is based on the use of a deterministic - conceptual model for the conversion of precipitation to runoff, using the standard provided by the HEC-1 model of the U.S. Army Corps of Engineers (U.S. Army Corps of Engineers, 1990), or its equivalent one with graphical user interphase, the HEC-GeoHMS model (U.S. Army Corps of Engineers, 1998). The model used in this study is RAINFLO, developed by Dr. Victor M. Ponce in 1986 emulating the HEC-1 standard. This model gives comparable results with the HEC-1 model (Lantz, 1989) and has been tested in diverse geographical regions, including Baja California (Ponce et al., 1985; Shetty and Ponce, 1997; Ponce et at., 1999).
The main characteristics of the RAINFLO model are the following:
The methodology followed in the present study considers the following steps:
DATA MANAGEMENT
The drainage basin for Cottonwood- Alamar Creek is contained within 17 USGS topographic maps to scale 1:24000 in San Diego County (California), and three INEGI topographic maps to scale 1:50000 in the municipalities of Tijuana and Tecate (Baja California), as follows:
The topology of the drainage network for Alamar Creek is shown in Fig. A-1. In the RAINFLO model, the subbasins are of two types: (1) upstream (upland watershed); and (2) lateral (reach watershed). The topological numbers that characterize the upstream subbasins have 2 digits; for example, 10 (upland watershed of San Pablo Creek). The topological numbers that characterize the lateral subbasins have five digits; for example, 30201 (first reach watershed of La Posta Creek). The virtual subbasins are used in order to enable the printout of results at critical points (downstream of Morena and Barrets Dams and upstream of the channelization project). The null reaches are provided to make possible the joining of two or more tributaries at the same geometric location. The hydrologic characteristics of the subbasins used in the model are shown in Table B-2. The total basin area of the Alamar Creek is 138,710 ha, or 1387.1 km2. Of this area, 26,446 ha (19.07 percent) correspond to upstream subbasins (upland watersheds), and 112,264 ha (80.93 percent) to lateral subbasins (reach watersheds). The tributary area to Morena Dam measured in this study is 30,704 ha, or 22.14 percent of the total basin. The tributary area to Barrett Dam, excluding Morena, is 31,289 ha, or 22.56 percent of the total basin; therefore, the total tributary area of Barrett Dam is 61,993 ha, or 44.69 percent of the total basin. The area of the "free basin," which excludes that of Barrett Dam, is 76,717 ha. These values are compared with the reported areas by the City of San Diego: for Morena, 114 square miles, or 29,513 ha; for Barrett, 134.3 square miles, or 34,769 ha, excluding Morena; and 251.9 square miles, or 65,214 ha including Morena. It should be mentioned that the National Water Commission considers the tributary area of 34,450 ha for Barrett Dam (Comision Nacional del Agua, 1993). Given the basin area, 24-hour design storms were selected for the 2-, 5-, 10-, 25-, 50- and 100-yr return periods. For each return period, a value of storm precipitation (cm) is obtained at the centroid of each subbasin. The Gumbel method was utilized to extend the precipitation data beyond 100 years, to 200, 500 and 1000 yr. The results are shown in Table B-3. The data on monthly levels for Morena and Barrett Dams corresponding to the periods of record (1912-2000 for Morena Dam and 1922-2000 for Barrett Dam) was analyzed in order to determine the mean monthly level (MML) for each month of the year, from which the mean MML (MMLmean) and the maximum MML (MMLmax) were obtained. This data is shown in Table B-4 and Table B-5 and Fig. A-2 and Fig. A-3. For Morena Dam, the MMLmax = 122.50 ft and MMLmean = 120.09 feet; for Barrett Dam, the MMLmax = 121.60 feet and MMLmean = 115.42 feet. These values are referred to mean sea level and converted to the metric system for their use in the model. For Morena Dam, the MMLmax = 915.894 m and MMLmean = 915.159 m; for Barrett Dam, the MMLmax = 477.841 m and MMLmean = 475.957 m. The data of elevation-volume-discharge for Morena and Barrett Dams were provided for the Department of Water of the City of San Diego. The elevations are referred to mean sea level, and the elevation-volume-discharge data was converted to the metric system for use in the model. Table B-6 and Table B-7 show the elevation-volume-discharge data used in the model. Table C-1 shows a typical calculation of runoff curve number, following the procedure established by San Diego (1985). The runoff curve numbers calculated for each subbasin are shown in the last column of Table B-2. The cross-sections were measured in the field during the months of November and December of 2000. In total, 50 cross-sections were measured in San Diego County and the municipalities of Tijuana and Tecate. In some reaches of difficult access, the cross-sections were estimated based on information for similar neighboring basins. The cross-sections and the streambed slope are used to calculate the routing parameters of the Muskingum- Cunge method. The infiltration velocity, of which the calculation of the channel transmission losses are based, is estimated based on similar experiences and recommendations of hydrology manuals of practice. The NEH-4 Manual (USDA SCS National Engineering Handbook 4) recommends a value of 1-3 in/hr (0.000007-0.000021 m/s) in mixtures of sand and gravel with small silt and clay content (Soil Conservation Service, 1985). As additional reference, Matlock (1965) measured velocities of infiltration in the dry river bed of the Santa Cruz river, in Tucson, Arizona, with values up to 0.000266 m/s, although the majority of these values were under 0.000088 m/s (Ponce et al., 1986). For purposes of this study, a mean value of 2 in/hr (0.000014 m/s) was adopted for the streambeds of the Cottonwood- Alamar river basin. The typical RAINFLO input file, corresponding to the 100-yr return period, is shown in Table D-1.
RESULTS
The RAINFLO model was used for the purpose of converting precipitation to runoff in the Cottonwood-Alamar river basin, under diverse conditions. The time interval (time step) was fixed at 7.5 minutes, which is considered sufficiently small to numerically resolve the 24-hr storm. The total simulation time was set at 5 days. For the channel routing with the Muskingum- Cunge method, the Courant number was controlled equal to or greater to 0.5 to assure numerical stability and equal to or smaller than 2 to assure convergence, i.e., the precision and consistency with the difusive wave equation (Cunge, 1969; Ponce and Simons, 1977; Ponce et al., 1978; Ponce and Theurer, 1982; Ponce, 1989). The following runs with the model were accomplished:
The results of Series A are shown in Table B-8. The difference between lines 6 and 5, shown in line 7, corresponds to the local contribution of the channelization project reach (40117). Line 8 shows the adopted flood discharge, rounded to the third significant figure. The flood hydrographs corresponding to return periods of 2 to 1000 yr, upstream and downstream of the channelization project, are shown in Table E-1. The results of Series B are shown in Table B-9. From this picture it is concluded that the mean annual discharge, corresponding to the 2-yr return period, feeds 0.459 hm3 [1 hm3 = 1 million cubic meters] to the groundwater table, which constitutes 4.6 percent of the flood runoff volume. The concrete channel would keep this volume in the surface runoff, and would increase the peak discharge by 6 m3/s. Values corresponding to other return periods are indicated in the same table. In contrast to the volume drained during the flood, the mean annual runoff of Alamar Creek has been calculated as 65.416 hm3, on the basis of the 1979-92 records (Comision Nacional del Agua, 1993). Likewise, the volume of water extracted annually from the aquifer of the Tijuana river basin, including Alamar Creek, is 13.8 hm3 (Comision Nacional del Agua, 1997). Assuming for the mean annual runoff a conservative value of infiltration volume equal to that of the mean annual flood (2-yr return period) (4.6 percent) (Table B-9), the postulated channelization would impede that an annual volume equal to (or greater than) [4.6 × 65.416 hm3]/100 = 3.01 hm3 will reach the water table through percolation. This quantity represents [3.01 / 13.8] × 100 = 21.8 percent of the groundwater resources of all the Tijuana region, which is a substantial quantity (i.e., more than one-fifth of the annual volume of groundwater exploitation would be lost to surface runoff by channelization).
CONCLUSIONS
The conclusions of this study are shown in Table B-8, specifically in line 8: "Adopted design discharge." The pertinent authorities should select the appropriate return periods for design purposes. According to current regulations, for the delineation of federal zones, the National Water Commission will have to select a return period greater or equal to 10 yr, for which the design discharge will not be less than 680 m3/s. The Instituto Municipal de Planeaci�n (IMPlan) of the City of Tijuana, pending consultation with the pertinent technical authorities, should select an appropriate return period for the design of the channelization project. The interpretation of current regulations permits to establish a return period between 50 and 200 yr for populated agricultural zones, assuming a development of this type. Therefore, in this case the design discharge will not be less than 1140 m3/s and could be as high as 1420 m3/s.
REFERENCES Chow, V. T., 1959. Open-channel hydraulics. McGraw-Hill, New York. Comisión Nacional del Agua, 1993. Cuenca Arroyo El Alamar, Tijuana, B.C., Estudio Hidrológico. Gerencia Estatal de Baja California, Subgerencia de Administración del Agua, Ensenada, B.C. Comisión Nacional del Agua, 1994. Datos hidrológicos, Arroyo Alamar, Tijuana.. Gerencia Regional de la Península de Baja California, Subgerencia Regional Técnica, Mexicali, B.C. Comisión Nacional del Agua, 1997. Diagnóstico actual y propuesta de explotación y tratamiento de los pozos de agua potable de la ciudad de Tijuana, Baja California. Despacho Ing. Héctor David Ramírez López. Cunge, J. A., 1969. On the subject of a flood propagation computation method (Muskingum method). Journal of Hydraulic Research, 7(2), 205-230.
Lantz, D. G., 1989. A comparative analysis of four rainfall-runoff models on small watersheds near Tucson, Arizona. M. S. Thesis, Watershed Management, School of Renewable Natural Resources, University of Arizona, Tucson, Arizona. Matlock, W. G., 1965. The effect of silt-laden water on infiltration in alluvial channels. Disertación, Universidad de Arizona, Tucson, Arizona. National Weather Service, 1973. Atlas 2: Precipitation Atlas of the Western United States. National Oceanic and Atmospheric Administration, Washington, D.C. Ponce, V. M., and D. B. Simons. 1977. Shallow wave propagation in open channel flow. Journal of de Hydraulics Division, ASCE, 103(HY12), 1461-1476. Ponce, V. M., R. M. Li, and D. B. Simons. 1978. Applicability of kinematic and diffusion models. Journal of de Hydraulics Division, ASCE, 104(HY3), 353-360. Ponce, V. M., and F. D. Theurer. 1982. Accuracy criteria in diffusion routing. Journal of de Hydraulics Division, ASCE, 108(HY6), 747-757. Ponce, V. M., Z. Osmolski, and D. Smutzer, 1985. Large basin deterministic hydrology: A case study. Journal of Hydraulic Engineering, ASCE, 111(9), 1227-1245. Ponce, V. M., 1989. Engineering hydrology: Principles and practices. Prentice Hall, Englewood Cliffs, New Jersey, USA. Ponce, V. M., and R. H. Hawkins, 1996. Runoff curve number: Has it reached maturity? Journal of Hydrologic Engineering, ASCE, 1(1), 11-19. Ponce, V. M., R. P. Pandey, and S. Kumar, 1999. Groundwater recharge by channel infiltration in El Barbon basin, Baja California, Mexico. Journal of Hydrology, 214(1999), 1-7. San Diego County, 1985. Hydrology Manual. Department of Public Works, San Diego, California. Shetty, A. V., and V. M. Ponce. 1997. Simulation of daily hydrograph and monthly discharge of an Indian Hard Rock stream. IE(I) Journal-CV, India, 77, 199-204. Soil Conservation Service, 1985. National Engineering Handbook, Section 4: Hydrology. United States Department of Agriculture, Washington, D.C. U.S. Army Corps of Engineers, 1990. HEC-1, Flood hydrograph package: User's manual. Hydrologic Engineering Center, Davis, California. U.S. Army Corps of Engineers, 1998. HEC-GeoHMS, Version 1.0 for Arcview Hydrologic Engineering Center, Davis, California.
APPENDICES
|
|
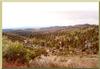
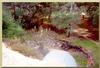
| Confluence of San Pablo Creek (20901) with Tecate Creek (31403). |