| Documents in Portable Document Format (PDF) require Adobe Acrobat Reader 5.0 or higher to view; download Adobe Acrobat Reader. |
DRAFT SUPPLEMENTAL ENVIRONMENTAL IMPACT STATEMENT FOR THE CAMPO REGIONAL LANDFILL PROJECT
- COMMENTS -
Victor M. Ponce
05 May 2010
|
This document provides comments to the Draft Supplemental Environmental Impact Statement (DSEIS) for the proposed
Campo Regional Landfill Project. The DSEIS was prepared by the Bureau of Indian Affairs in cooperation with the
Campo Band of Mission Indians, the Campo Environmental Protection Agency, and the U.S. Environmental Protection Agency.
This document is organized into various headings.
Headings are organized topically to comment on major issues raised by the DSEIS.
The siting of the Campo landfill on top of a fractured rock aquifer,
barring appropriate characterization of the fractured rock system, and without adequate monitoring
to prevent contaminant leakage beyond the landfill
perimeter, threatens the quality of life of nearby residents, both on and off the reservation.
Subsurface flow direction in a fractured rock aquifer
defies characterization and absolute certainty.
Thus, aquifer contamination remains a distinct possibility.
Once the groundwater has become contaminated, it will be very difficult to remediate.
The contaminated water may tend to diffuse into the rock matrix's stagnant pore water, increasing the difficulty of cleanup.
Another source of concern is the possible mobilization of chemical elements in the rock,
as a result of the biogeochemistry of the leachate plume.
The absence of a detailed plan for east-side well monitoring for nearly two-thirds of the landfill footprint
is a serious omission of the DSEIS. As currently conceived, the plan is expected to provide monitoring wells
at a distance of about 500 feet on the east side. This is insufficient and a cause for grave concern.
The federal designation of the Campo-Cottonwood Creek aquifer, which includes the Tierra del Sol aquifer, as sole source
means that if this aquifer
becomes contaminated, there are no reasonably available sources of water. Mitigation measures have promised to
make up for this, but no feasible alternative sources have been identified.
Once the state-avowed target of 75% waste diversion is fully in place,
the need for additional landfill space in San Diego County will be significantly reduced for the next several decades.
It is highly improbable that the county would need to
rely on the Campo landfill for its solid waste disposal needs well into the future.
Therefore,
to remain in business, the Campo landfill will have to import waste from much farther sources and,
at that point, may have to consider receiving other types of wastes, including special wastes.
The neglect of the February 24, 1892 earthquake, of Magnitude 7.8, the largest on record, is a serious omission of the DSEIS.
The Maximum Credible Earthquake (MCE) may have to be recalculated.
Strong ground motions can reset the pressure in the
fractured rock aquifer and can cause very large temporary increases in water pressure.
No liner taking a direct hit can withstand these pressure increases.
In summary, the proposed Campo landfill site lies:
(1) on top of a fractured rock aquifer,
(2) on a headwater basin where very intense storms are possible,
(3) within close reach of the groundwater, and
(4) in a region prone to strong earthquakes. This
poses a high risk of contamination of the designated sole-source aquifer.
Significantly, the conjunction of four natural geologic loads or hazards foretells of disasters waiting to happen.
Thus, the project presents a serious threat to the public health and safety of nearby residents, both on and off the reservation,
as well as to residents of neighboring Mexican communities.
|
1. INTRODUCTION
The Bureau of Indian Affairs has prepared a Draft Supplemental Environmental Impact Statement (DSEIS) for the proposed Campo Regional Landfill Project, to be located on the Campo Indian Reservation in San Diego County, California. The DSEIS was made public on February 26, 2010.
A 75-day public comment period has been provided. The 75-day public comment period expires May 12, 2010. This document provides comments to the DSEIS.
2. CHOICE OF SITE
The Campo Indian Reservation comprises 16,000 acres in southeastern San Diego County,
close to the United States-Mexico border.
Its southern boundary lies at a distance of 0.4 miles from the border (Bureau of Indian Affairs, 2010).
The project site consists of a 1,150-acre parcel located on the southeastern end of the reservation.
The actual landfill footprint is a 493-acre site on a 1-mile-wide narrow strip bound on three sides
by neighboring private lands, as shown in
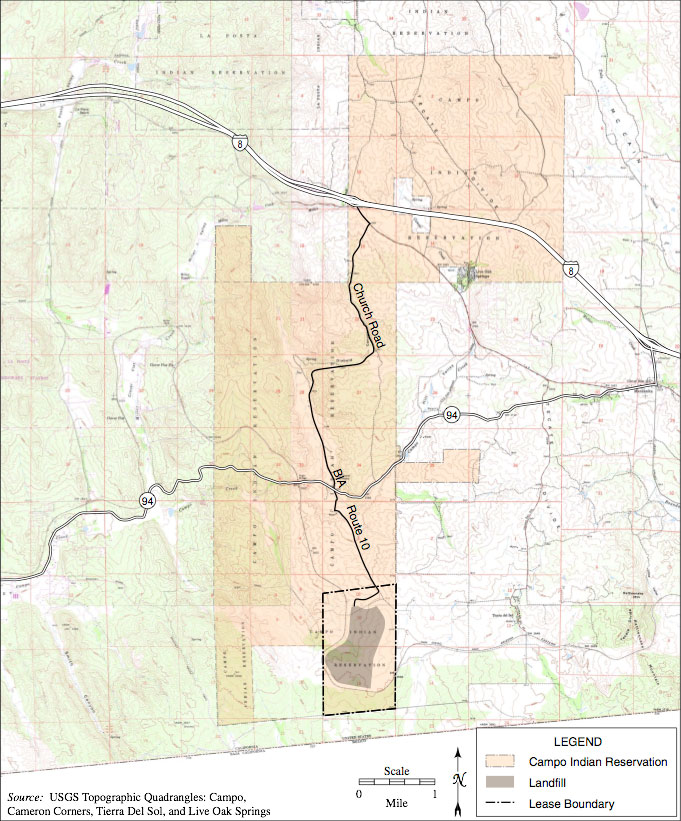
|
Fig. 1 Location of Campo Indian reservation, with proposed landfill at the southeast end
(Bureau of Indian Affairs, 2010).
Chosen project site maximizes impact on private lands
The chosen project site maximizes the impact on adjoining private lands. Given the geographical outline of the Campo Indian reservation, and because the landfill site constitutes only 3% of the total reservation area, any other alternative site, within the reservation, would have in effect minimized the impact on private lands.
The risk of aquifer contamination due to landfill leakage remains a distinct possibility. A state-of-the-art landfill engineering design may contribute to reduce this risk; however, this risk reduction holds true for any site. Thus, the choice of site implies that the project will place most of the risk on adjoining private property.
The DSEIS endorses, without further review, the Final Environmental Impact Statement (FEIS) of November, 1992 (Campo Indian Reservation, 1992b). According to the FEIS, the proposed site is preferred over two other alternatives because (Bureau of Indian Affairs, 2010; p. 2-40):
- It is adjacent to the existing railway,
- It does not have any upstream drainage area,
- It has less impact on oak woodlands,
- It has less impact on [reservation] cultural resources, and
- It is in conformance with the Campo land use plan.
The DSEIS states that the railway will no longer be used for hauling trash; thus, Reason 1 is no longer valid. The DSEIS states that the other four reasons (2, 3, 4, and 5) remain valid. In particular, Reason 2 merits elaboration here. Unlike other alternatives, the proposed location, on the headwaters of Lower Campo Creek, is an important recharge zone for groundwater. Thus, groundwater quantity will be substantially impacted due to denied recharge (Section 11).
The landfill project will also affect reservation land and water resources downstream of the site, specifically in the Lower Campo Creek watershed. Therefore, many of the comments of this report regarding possible negative impacts to immediate neighbors are also applicable within the reservation (see Sections 5 and 9).
3. FRACTURED ROCK AQUIFER
The Campo Indian Reservation comprises 16,000 acres in southeastern San Diego County,
close to the United States-Mexico border.
Its southern boundary lies at a distance of 0.4 miles from the border (Bureau of Indian Affairs, 2010).
The project site consists of a 1,150-acre parcel located on the southeastern end of the reservation.
The actual landfill footprint is a 493-acre site on a 1-mile-wide narrow strip bound on three sides
by neighboring private lands
The proposed Campo Regional Landfill Project is underlain by a fractured rock aquifer belonging to the Peninsular Range batholith. Fractured rock aquifers differ from sedimentary aquifers in the following three important respects:
- Water and associated contaminant plumes travel faster in fractured rock aquifers, primarily by convection through fractures,
- Water and plumes travel directionally along the fractures, in one or two dimensions,
- The fractures may change direction unexpectedly, defying precise characterization.
Thus, landfill projects in fractured rock aquifers must be subjected to close scrutiny. Geophysical investigations may reveal the characteristic features of the prevailing fracture system, but some uncertainty will always remain. Siting a landfill on top of a fractured rock aquifer is risky. This is due to:
- The shorthened plume travel times provided by flow convection through fractures, and
- The uncertainties in characterizing fractured rock aquifers.
According to the U.S. Code of Federal Regulations (U.S. CFR, Title 40, Chapter 1, part 258.51 2006), a groundwater monitoring system must be installed in a municipal landfill. The system must consist of a sufficient number of wells to yield groundwater samples that represent the quality of groundwater, to ensure detection of groundwater contamination. Yet in a fractured rock aquifer on a headwater region (in this case, the top of a hill), the downgradient direction is uncertain, requiring that monitoring wells be placed at appropriate intervals surrounding the facility. This is clearly not the case at the proposed Campo landfill.
4. DIRECTION OF WATER AND PLUME MOVEMENT
The fractured rock aquifer underlying the proposed Campo landfill consists of unweathered to slightly weathered cristalline tonalites.1 These are overlain by
- a layer of highly weathered tonalites, and
- recent alluvial materials on or just below the surface.
The depth to the unweathered to slightly weathered tonalites varies from 70 to 132 ft (Bureau of Indian Affairs, 2010; p. 3.1-2).
Photogeologic lineaments
The Campo landfill site features an extensive array of photogeologic lineaments, many of which have a predominant west-east direction;
see
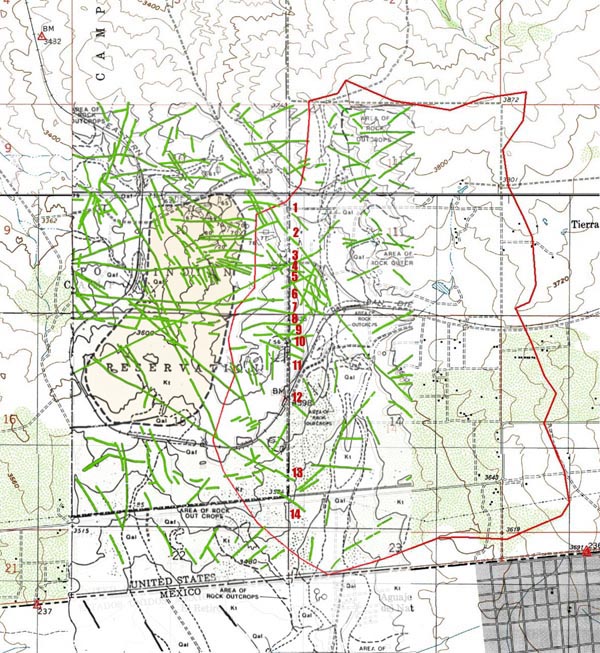
|
Fig. 2 Existing photogeologic lineaments in the vicinity
of the Campo landfill site (Ponce, 2006).2
Five major lineaments cross from the landfill footprint from west to east and are clearly visible from
the air; see
|
Fig. 3 Major photogeologic lineaments in the vicinity
of the Campo landfill site (Ponce, 2006).
The existence of a connection in the regional groundwater flow below the landfill and its eastern neighbors is
confirmed by a groundwater flow direction map
prepared by the landfill consultants for the original EIS
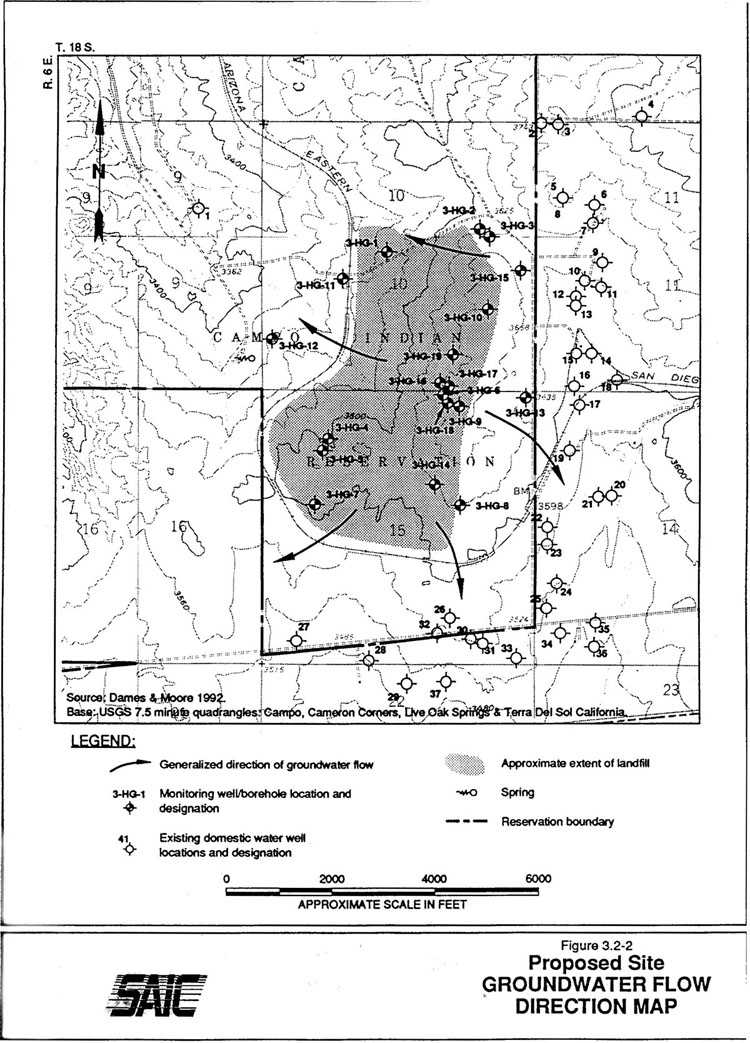 |
Fig. 4 Proposed site groundwater flow direction map
(click on figure to enlarge)
(Campo Indian Reservation, 1992a).
5. MONITORING WELLS
Figure 5 shows the network of monitoring wells proposed for phases 1-3 and 17-19 of the landfill project. The project plans to develop a similar network for other phases prior to their construction (Bureau of Indian Affairs, 2010). Figure 5 shows that the distance between wells varies between 200 feet on the west side of the landfill to approximately 500 feet on the east side. The total number of monitoring wells on the east side is four.
Plume widths
For the expected values of transverse dispersion, plume widths will be on the order of 100 feet (Bureau of Indian Affairs, 2010; Appendix C-4, p. 31). The DSEIS states that the expected spacing for monitoring wells should be on the order of the expected transverse dispersion of the plumes, i.e., 100 feet (Bureau of Indian Affairs, 2010; Appendix C-4, p. 31). Thus, the proposed number of monitoring wells along the east side is judged to be grossly insufficient. Contaminant plumes will most likely be missed by the scant number of wells on the east side.
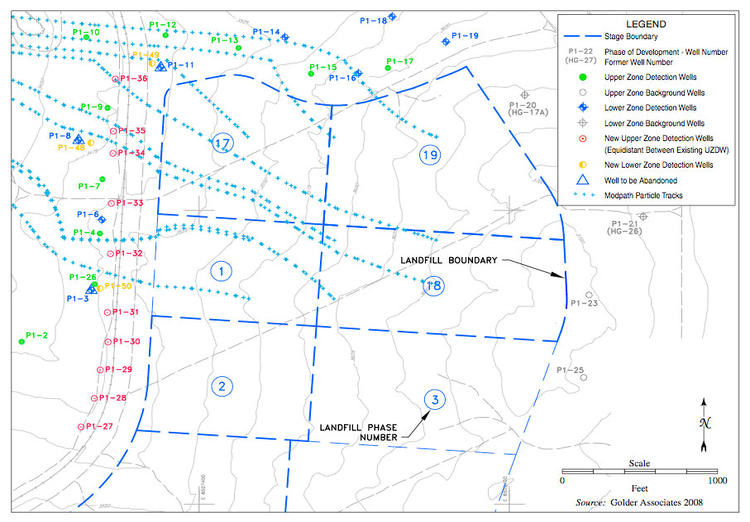 |
Fig. 5 Proposed network of monitoring wells for phases 1-3 and 17-19 (click on figure to enlarge)
(Bureau of Indian Affairs, 2010).
The absence of a detailed plan for east-side well monitoring for nearly two-thirds of the landfill footprint is a serious omission of the DSEIS. As currently conceived, the plan is expected to provide monitoring wells at a distance of about 500 feet on the east side. This is insufficient, and a cause for grave concern.
The DSEIS considers it very unlikely that leaks will occur in both the primary and secondary liners in the same area (Bureau of Indian Affairs, 2010; p. 2-15). A double-liner system is generally judged to be safer than a single-liner system. Yet, a double-liner system does not completely eliminate the possibility of groundwater contamination. The rationale for the double-liner system assumes that the primary liner will fail first, and the leachate will be recovered subsequently, or be retained by the secondary liner. However, there is the distinct possibility that the secondary liner will fail first, with the breach remaining undetected, and with no plume to track down, until the primary liner fails.
The DSEIS considers monthly inspections of the liner system to detect leaks. Leaks would be analyzed to determine the need for remedial action, including redirection of landfill activities and even early closure of a phase (Bureau of Indian Affairs, 2010; p. 2-8). Thus, the possibility of liner leakage and aquifer contamination remains.
Monitorability
In terms of monitorability, the DSEIS does not add significantly to the previous Campo landfill project (Campo Indian Reservation, 1992a; 1992b). On January 4, 1993, the Environmental Protection Agency (EPA) rated the DEIS as EO-2 -- Environmental Objections -- Insufficient Information.3 The letter stated that the rating was based on the belief that "compliance with groundwater monitoring and corrective action required by federal criteria (40 CFR Part 258) could prove difficult or unfeasible in the geologic setting of the proposed landfill." Thus, the issue of the site's unmonitorability has not been resolved by the DSEIS.
Difficult remediation
A significant concern, not addressed in the DSEIS, is the practical difficulty of restoring a fractured rock aquifer that has been contaminated. The contaminated water tends to diffuse into the rock matrix's stagnant pore water, increasing the difficulty of cleanup. While the cleanup problem is more serious in sedimentary rock aquifers, even in crystalline rocks the attainment of very high levels of water quality may be problematic (Mutch et al., 1991).
Mobilization of chemicals
Another source of concern is the possible mobilization of chemical elements or compounds contained in the sediments and rock, as a result of the geochemistry of the leachate plume. For example, in the Saco Municipal Landfill near Saco, Maine, a plume of arsenic with concentrations as high as 700 micrograms per liter has been documented (U.S. Geological Survey, 2008). Arsenic, a notoriously poisonous metalloid, found free in nature, is a component of pesticides, insecticides, and herbicides.
Studies at the Saco landfill have shown that the source of the arsenic is not the landfill, but appears to be the sediments the plume is moving through. USGS has shown that dissolved organic carbon in the leachate plume is dissolving arsenic from arsenic-containing iron oxides in the aquifer and bedrock. The dissolution occurs because the degradation of the dissolved organic carbon in the plume removes oxygen from the water and creates reducing conditions that favor the dissolution of iron oxides and the release of arsenic from the sediments.
Cyanide leaching
That a landfill leachate should leach arsenic from host rocks should come as no surprise. For example, cyanide leaching is a standard method for extracting microscopic pieces of gold from host rocks.4 Thus, as a leachate travels through fractured rock, it could leach certain chemicals that are present in the rock matrix, depending on the leachate's chemical composition and the rock's mineralogy.
6. TRAVEL TIME
The travel time is the time it takes a contaminant plume to show up in neighboring wells. The travel time is a function of the advective velocity through fractures. The larger the advective velocity, the shorter the travel time.
The DSEIS states that the greatest volume of groundwater storage occurs in the shallower, more porous weathered tonalite, but flow velocities may be highest through joints and fractures in the deeper, less weathered and unweathered tonalite. The DSEIS recognizes that groundwater flow systems within the shallower weathered tonalite and the deeper unweathered tonalite fracture system are likely to be interconnected (Bureau of Indian Affairs, 2010; p. 3.2-6).
Seepage velocities
The DSEIS states that tracer tests resulted in estimated seepage velocities of 3.6 to 9.0 feet per day. They also reported that the fractured rock system is anisotropic, with horizontal velocities likely to be an order of magnitude greater than vertical velocities. Thus, groundwater flows more readily horizontally than vertically (Bureau of Indian Affairs, 2010; p. 3.2-8).
To cite other measured seepage velocities, Jeffers and Wittig (2004) performed a hydrogeologic characterization of a tonalite fractured rock aquifer below the closed Jamacha landfill in western San Diego County. Due to the low effective porosity, groundwater velocities in the fractured rock aquifer were estimated to reach 40 feet/day. Furthermore, aquifer tests confirmed the communication between upgradient and downgradient wells.
In some fractured rock aquifers, the seepage velocities may reach hundreds of feet per day, which is equivalent to the hydraulic conductivity of the most permeable gravels. These fracture zones of high advective velocity are very narrow and difficult to detect, yet they transport most of the solute mass away from the landfill.5 Monitoring wells would have to intersect these fractures in order to detect any contamination. Given the proposed distance of 500 feet between wells, it is very unlikely that a plume within a given fracture will be detected.
Local events
The short travel time of groundwater flow in the vicinity of the Campo landfill is confirmed by local events. In 1991, Tierra del Sol neighbors experienced the occurrence of sand and salty water in their wells, at about the same time that Dames and Moore, the original landfill engineering consultant, was performing exploratory drilling on the site.6,7 The apparent cause-effect relation between the drilling on the Campo landfill site and the sanding and salty water on neighbors' wells should be a cause for concern.
Advective transport
Solute transport in a fractured rock aquifer will be predominantly advective, with little diffusion of the contaminant plume. Thus, concentrated leachates will travel long distances quite rapidly, in unforeseen directions. It is almost impossible to guarantee containment in all circumstances. It is technically feasible to reduce the distance between monitoring wells to implement a line of defense resembling a picket fence; however, the cost would be prohibitively high. Moreover, such a high well density, if implemented, is likely to change the local hydraulics and do more harm than good in the long run. This is because a borehole acts as a high-permeability pathway that connects fractures which previously were unconnected, as shown by USGS experience (Shapiro, 2001).
7. GROUNDWATER CHARACTERIZATION
The DSEIS groundwater characterization and modeling programs is Appendix C-4 of the DSEIS (Bureau of Indian Affairs, 2010). Distinct fractures are observed at various depths within the upper and lower tonalites. The zones of weathering associated with the identified features may be two to three feet in thickness (Bureau of Indian Affairs, 2010; Appendix C-4, p. 12).
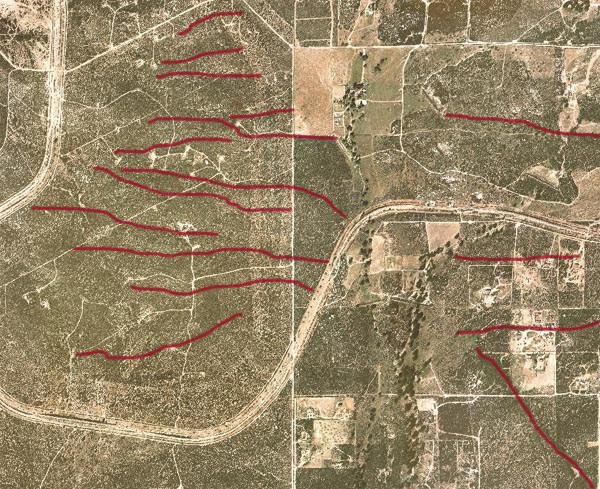
West-east lineaments
The DSEIS recognizes that there are several west-east lineaments crossing the Campo landfill site toward private lands along the east.
These lineaments, shown in
 |
Fig. 6 West-east photogeological lineaments on the Campo landfill site (click on figure to enlarge)
(Bureau of Indian Affairs, 2010; Appendix C-4).
The proven existence of these lineaments raises a significant concern that a landfill leak may reach private lands immediately east of the landfill. The DSEIS states that the most prominent fractures strike NNW, with moderate to shallow dips to the SW. Yet other fractures strike ENE to WNW, with moderate to steep dips to the N and S (Bureau of Indian Affairs, 2010; Appendix C-4, p. 12).
Floristic indicators of groundwater
The Campo landfill site and the adjoining Tierra del Sol watershed lie on extensively fractured rock.
A typical fracture in a rock outcrop in the Tierra del Sol watershed is shown in
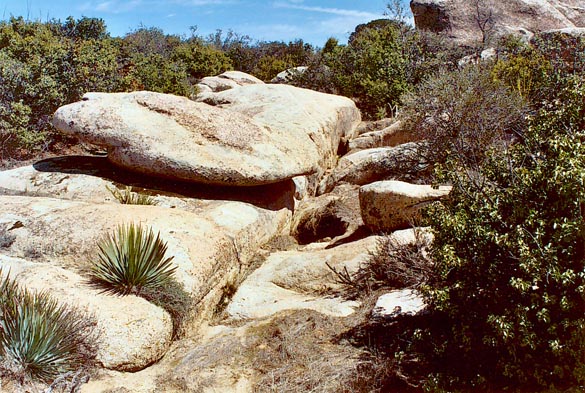
|
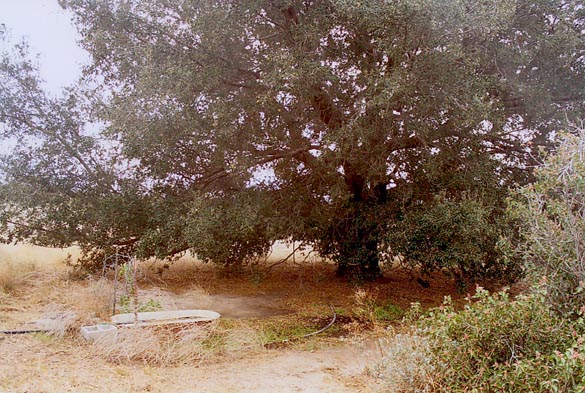
Fig. 7 Fracture in rock outcrop in Tierra del Sol watershed,
adjoining the Campo landfill site.
Dikes and springs
The tonalite
bedrock in the vicinity of the Campo landfill site features a large number of pegmatitic dikes, typically granitic in mineralogical composition,
some of which are exposed locally (Bureau of Indian Affairs, 2010; p. 3.1-2). One such dike, of large size, is shown in
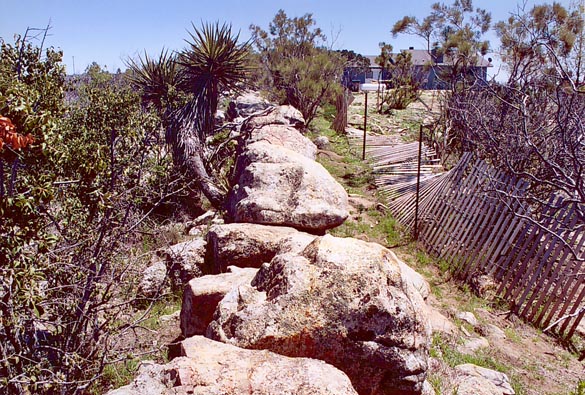
|
Fig. 8 Large pegmatitic dike in Turner Ranch, in the Tierra del Sol watershed.
|
Fig. 9 Spring at the western (downstream) end of large dike in Tierra del Sol watershed,
adjoining the Campo landfill site.
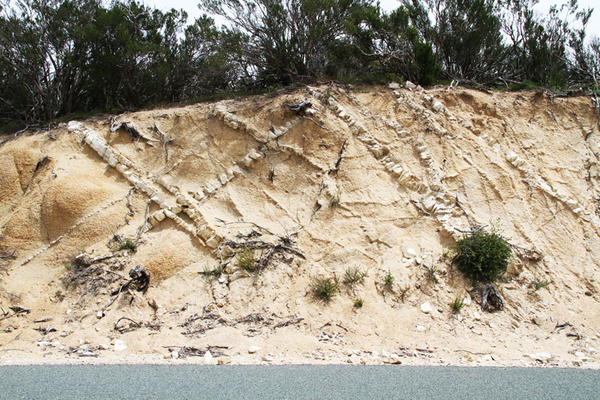
Figure 10 shows several small pegmatitic dikes, some dipping at right angles to each other, exposed on a road cut on Tierra del Sol road. This figure confirms the extent and characteristics of dikes and fractures in the Tierra del Sol watershed.
|
Fig. 10 Pegmatitic dikes dipping at right angles, exposed on a road cut on Tierra del Sol road.
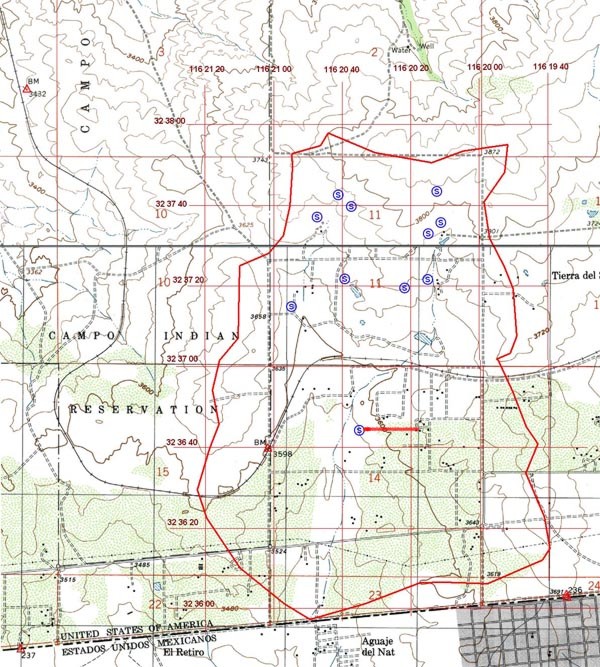
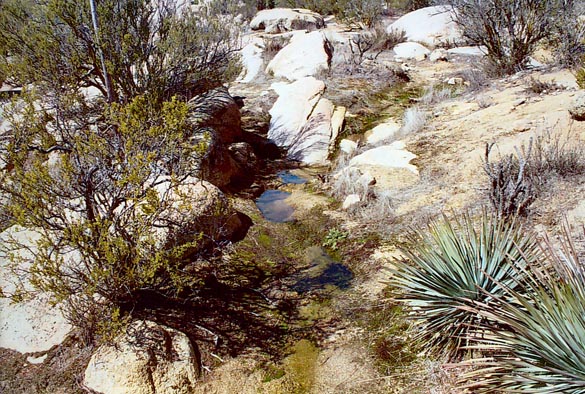
The numerous springs which dot the Tierra del Sol watershed and surroundings have been discussed by Ponce (2006), and featured in Tierra del Sol fights for clean water (Visualab Productions, 2009). Figure 11 shows the location of eleven (11) springs that have been documented in the Tierra del Sol watershed. One such spring is located less than 1,500 feet from the landfill footprint. As shown in Fig. 11, springs indicate the downstream location of geologic features such as fractures or dikes (straight red line in this figure) intersecting the ground surface. Figure 12 is a close-up of one of the springs documented in the Tierra del Sol watershed.
|
Fig. 11 Springs and large dike documented in the Tierra del Sol watershed
(Ponce, 2006).
|
Fig. 12 Close-up of a spring in the Tierra del Sol watershed
(Ponce, 2006).
8. DEPTH TO GROUNDWATER
The DSEIS states that the depth to groundwater varies spatially within the project site, from approximately 8 to 90 feet, and generally decreases downslope of the landfill footprint (Bureau of Indian Affairs, 2010; p. 3.2-9). Yet the DSEIS does not document seasonal and annual variations which may have the effect of reducing the stated minimum depth of 8 ft.
High variability of annual rainfall
The DSEIS does include the precipitation data from the
Campo weather station [in Campo, San Diego County] for the period 1901-2007, shown in
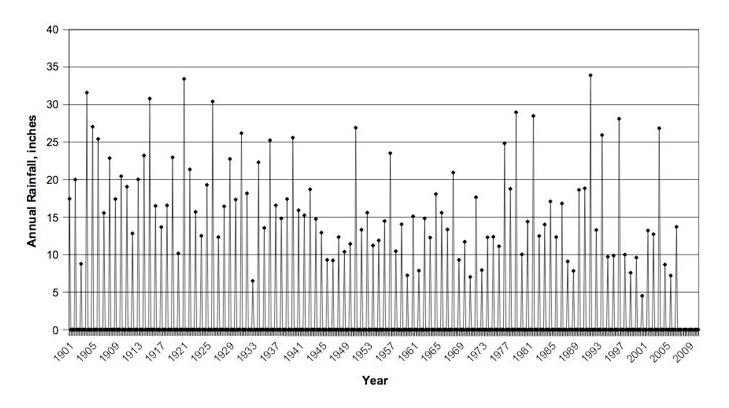 |
Fig. 13 Annual rainfall for the Campo weather station, 1901-2007 (click on figure to enlarge)
(Bureau of Indian Affairs, 2010).
Most intense precipitation in the region
Significantly, the Campo weather station has reported one of the most intense precipitation events ever recorded west of the U.S. Continental Divide: 11.5 inches in 80 minutes, on August 12, 1891.8, 9 [The total for the month of August was 16.10 inches; and for the year 1891, 35.31 inches, the largest on record].10 An eyewitness account reported that the raingage washed away, so the recorded rainfall amount, as high as it is, may have been incomplete.11 Judging by the fate of the Campo raingage during the 1891 storm, it is possible that a very large flood could overwhelm the landfill's storm drainage system, compromising the integrity of the landfill.
The relation between annual rainfall and groundwater table elevation has been documented by Ponce (2006). Using Tierra del Sol data for the period 1991-2005, he showed that rainfall and groundwater table elevation are directly related in a fractured rock aquifer, as shown in Figs. 14 and 15.
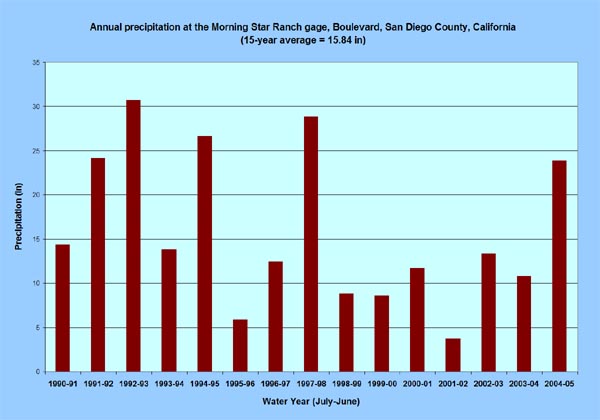
|
Fig. 14 Annual precipitation at the Morning Star Ranch, Tierra del Sol,
San Diego County, California, 1990-2005
(Ponce, 2006).
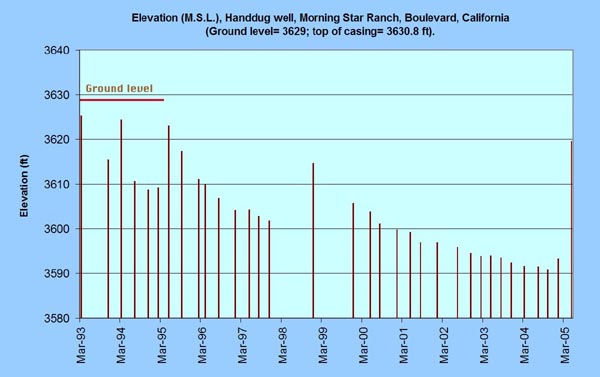
|
Fig. 15 Elevation above mean sea level at Handdug well, Morning Star Ranch,
Tierra del Sol, San Diego County, California, 1993-2005
(Ponce, 2006).
Measurements of depth to groundwater
As shown in Fig. 13, the 1992-93 rainy season had the highest annual precipitation on record at the [National Weather Service] Campo weather station. Likewise, as shown in Fig. 14, the 1992-93 rainy season had the highest annual precipitation on record at the Morning Star Ranch raingage, located about 1,800 feet east of the proposed Campo landfill.
The County of San Diego Department of Planning and Land Use performed mandated measurements of depth to water table on March 4, 1993.12 The water level below the land surface (BLS) was measured in 25 wells in the Boulevard/Proposed Campo Landfill area. The reported BLS water levels (depths) were the following:
- up to -1.2 feet in 3 wells, i.e., under artesian conditions,
- less than 1.0 foot in 8 wells,
- less than 4.1 feet in 20 wells, and
- less than 6.5 feet in 22 wells.
At the time (March 1993), the County groundwater geologist reported that the aquifer was at storage capacity, with a surprisingly high number, areal extent, and flow rates of springs in the area.12 Springs were noted virtually everywhere throughout the monitoring area, including both topographically high and low areas. Since there had been no rain for over a week prior to monitoring (on March 4), the observed surface water was virtually all surfacing groundwater.12
The County 1993 well data confirms that during wet years, the water level below the land surface throughout most of the area may reach values less than 5 feet, contradicting the stated 8-feet minimum depth reported by the DSEIS (Bureau of Indian Affairs, 2010; p. 3.2-9).
Regulations for depth to groundwater
Existing regulations for the minimum vertical depth from bottom of landfill to highest groundwater elevation vary with state and country. These have been documented in a comprehensive report (GeoSyntec, 2004). Nine states, including California, were chosen for this study. Required depths varied from as little as 4 feet in West Virginia to as much as 100 feet in New Mexico. California's requirement, 5 feet, was the median, while the average was 18 feet.
Of the eight states reviewed in the cited report, engineered alternatives are provided to the minimum depth to groundwater in six states, including California. Yet according to the report, of the 27 sites in California where groundwater is within 5 feet of the waste, 8 sites (i.e., 30 percent) are listed in the category "In Corrective Action" (GeoSyntec, 2004).
The same report documented regulations for five countries around the world, including Australia, Brazil, the European Union, South Africa, and Japan. In Australia, it is 2 m; in Brazil, 3 m; in South Africa, 2 m. Significantly, the European Union does not state a minimum depth; instead, it states that "The location of a landfill must take into account ... geological and hydrogeological conditions..."
California regulations are among the least conservative
California regulations, which require a 5-feet minimum depth to groundwater, are among the least conservative anywhere. This reflects a state policy to allow landfills to be built in marginal sites, which implies that geographical, economic, and other concerns are deemed more important that the protection of groundwater quality. A case in point: [the states of] New York and Washington specifically require that landfills not be constructed immediately above sole-source aquifers; however, California does not have such a limitation (see Section 12).
Need for aquifer drainage during wet years
According to
9. GROUNDWATER MODELING
Appendix C-4 of the DSEIS describes the hydrogeologic conceptual model of the Campo landfill site (Bureau of Indian Affairs, 2010; Appendix C-4, p. 24). The current model differs in some primary respects from the original model developed for the FEIS, but appears to retain the equivalent porous media (EPM) modeling concept, while considering the most significant fractures; see Fig. 16 (c).
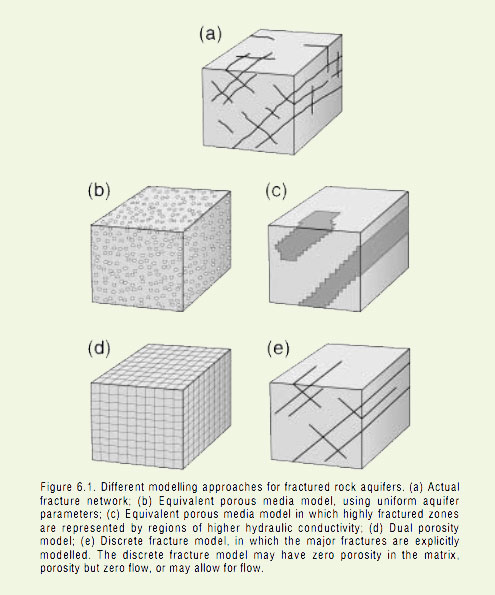
|
Fig. 16 Alternative approaches for modeling fractured rock aquifers
(Cook, 2003).
The DSEIS identified major topographic lineaments that act as drains for the regional flow system to the west (Bureau of Indian Affairs, 2010; Appendix C-4. p. 27). Drainage to the east, as documented by Figs. 3 and 6, was either not found or not considered.
Unpredictable nature of leachate plume
Generally speaking, constituent flow modeling works well in situations where the source of the contaminant plume is well defined in chemical composition and concentration. However, in landfill-leakage modeling, the situation is complicated by the unpredictable nature of the offending leachate plume.13 Thus, biogeochemical transport modeling of contaminant plumes following landfill leakage is nothing more than an educated guess. In addition, the lack of site-specific biogeochemical transport data precludes a meaningful model calibration.
10. JURISDICTIONAL WATERS OF THE UNITED STATES
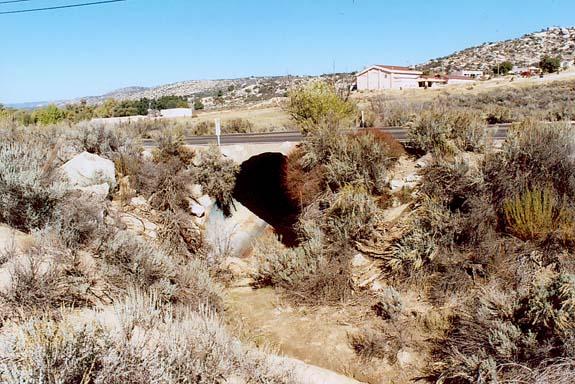
The proposed access road to the Campo landfill would cross Campo Creek, which is classified as a blue-line, intermittent stream by the U.S. Geological Survey (Bureau of Indian Affairs, 2010; p. 3.2-4). The U.S. Army Corps of Engineers typically decides on a case-by-case basis whether or not to classify creeks as jurisdictional waters in association with construction projects. Campo Creek may be considered a jurisdictional waterway because it is such a prominent creek in the project vicinity. A final determination will have to be made by the U.S. Army Corps of Engineers.
Figure 17 shows the intersection of Campo Creek with State Route 94. A short distance downstream of this location, at the intersection with Diabold Canyon Creek, the Campo Creek watershed measures 11.53 square miles (Ponce, 2005). Through this region, Campo Creek is an intermittent stream with flash flood capability.
Access road
The access road to the proposed Campo landfill crosses Campo Creek a short distance upstream from the intersection with State Route 94 (Fig. 17). A similar structure to that shown in Fig. 17 may be required for the access road. The proposed culverted Arizona crossing may be inoperable in times of flood, precluding full access to the site.
|
Fig. 17 Culvert crossing at intersection of Campo Creek with State Route 94,
San Diego County (Ponce, 2005).
11. DENIED RECHARGE
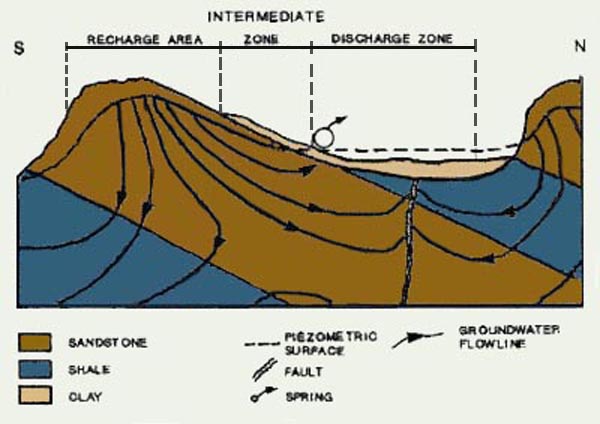
Groundwater is naturally recharged upstream and discharged downstream.
Recharge areas are close to mountain peaks, where precipitation is likely to be higher than in the adjacent lowlands.
Shallow groundwater discharges in the valleys and other low-lying zones
|
Fig. 18 Typical recharge and discharge in groundwater systems.
The Campo landfill project is located in the headwaters of Lower Campo Creek, immediately west of the Tierra del Sol watershed, which drains elsewhere, into Mexico. Thus, the project will compromise groundwater replenishment in the area by denied recharge.
Denied recharge refers to the reduction in groundwater replenishment due to project operations, as a result of the redirection of surface-water runoff from the landfill surface to basins along its perimeter. Declines in groundwater level have been estimated at 4 to 27 ft (Bureau of Indian Affairs, 2010; p. ES-13). This redirected discharge will increase groundwater levels at and immediately downgradient from the recharge basins, toward Lower Campo Creek.
Effect of denied recharge
Under normal, through-the-matrix surface-groundwater interaction, a water balance will show little loss of water by the forced redirection of surface waters and the change in location of groundwater replenishment. However, under a fractured rock aquifer, where the true downgradient direction cannot be readily ascertained, the denied recharge (redirected elsewhere through surface downgradient) may effectively reduce the rate of recharge in neighboring wells to the east. The closest domestic private well lies less than 1,500 feet from the edge of the landfill, making the impact too close to call.
12. SOLE-SOURCE AQUIFER
The Campo-Cottonwood Creek Sole-Source Aquifer was designated as such on May 5, 1993, under the authority of Section 1424(e) of the Safe Drinking Water Act (Federal Register Citation-49 FR 2948, January 24, 1984). An aquifer can be named a Sole-Source Aquifer by the Administrator of the Environmental Protection Agency if the aquifer supplies 50% or more of the drinking water for an area and there are no reasonably available alternative sources should the aquifer become contaminated.
There is a difference between the mitigation measures offered between the FEIS and the current DSEIS. The previous project included a property value protection guaranteeing alternative water sources for 20 years. The current project applicant has not offered a property value protection agreement for this proposed project. Therefore, additional mitigation is required with respect to a backup water supply (Bureau of Indian Affairs, 2010, p. ES-14). There are no readily identified and cost-effective alternative sources of water supply to be found in the vicinity. It will cost close to U.S $ 200 million (in 1993 dollars) to pipe in water from outside the region.14
No alternative source of water
The DSEIS describes the plan to establish a program for sampling of off-site domestic wells within the project area (Bureau of Indian Affairs, 20-10; p. 4.2-31). This is for the purpose of establishing background water quality to assess water quality impacts, should a release from the facility occur. Yet there is no indication of where the replacement water would be coming from. In essence, the project commits to provide alternative water in the event of groundwater contamination, but it does not state clearly how or where the additional water is going to come from.
13. WASTE STREAM
The DSEIS states that the project would compete for solid waste disposal contracts within San Diego County and the surrounding region (Bureau of Indian Affairs, p. ES-4). The DSEIS also states that the landfill could accept approximately 15 percent of the total San Diego County waste stream (Bureau of Indian Affairs, 2010; p. 1-1; p. 2-2). Yet it appears that it has no firm contracts to date. The site is located 60 miles from the city of San Diego; thus, Miramar and other county landfills are nearer to the source of waste.
Waste diversion in San Diego County
Every five years, the County of San Diego updates its
Integrated Waste Management Plan. The current review cycle
is in progress, with a final document expected September 2010 (County of San Diego, 2010).
A draft chart of the disposal capacity projection is shown in
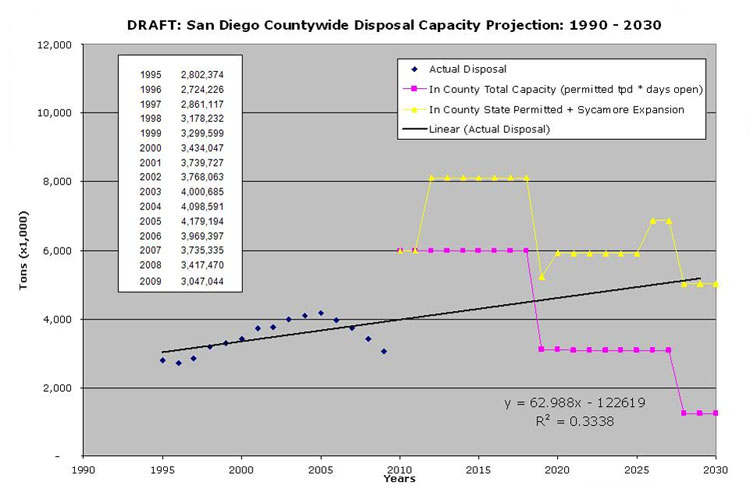 |
Fig. 19 County of San Diego disposal capacity projection 1995-2030
(click on figure to enlarge) (County of San Diego, 2010).
Zero Solid Waste policy
The State of California has a policy of zero solid waste. Acting on this policy, several bills have been submitted recently to the State Legislature in order to reach a 75% diversion level.16 The San Diego County Board of Supervisors, the San Diego Association of Governments (SANDAG), and the State of California have officially recognized that a 75% diversion rate in San Diego County would significantly reduce the need for additional landfills over the next several decades.
Current trends in waste diversion
Figure 19 shows a sharp decrease in actual disposal tons, starting in 2005. This reflects both the economic downturn and the fact that in the past five years, San Diego County has been making great strides to comply with the state-mandated directive to: (1) reduce, (2) reuse, (3) recycle, and (4) transform, as a sustainable alternative to landfilling.
The current countywide solid waste trend is in the direction of greater diversion. Therefore, to remain in business, the Campo landfill will have to import waste from much farther sources and, at that point, may have to consider receiving other types of wastes, including special wastes.17 [Special waste may pose an unusual threat to human health, equipment, property, or the environment]. All the while, the landfill's carbon footprint will be significantly increased, and the original plan--to receive municipal wastes--will be substantially altered.
Waste diversion in the European Union
Note that around the world, other countries are imposing similar directives to that of California. For example, the European Union Landfill Directive requires its member countries to reduce their biodegradable municipal waste by 25% in 5 years, 50% in 8 years, and 65% in 15 years, with 1995 used as baseline data.18 Following this directive, in the United Kingdom, the biodegradable solid waste will be reduced by 65% by 2020.19
The ultimate objective is to reduce the need for disposable solid waste either to zero or to a negligible amount, in effect, preempting the need for additional landfills. Landfills could pose a significant threat to the surrounding environment, as the specific case of Campo clearly shows. Thus, the only sensible course of action is to avoid or minimize the need for them.
Will San Diego solid waste go to the Campo landfill?
Existing regulations require the county to dispose of its solid waste, after recycling, first by using county facilities, and secondarily, by using out-of-county facilities. Therefore, the proposed Campo landfill would have to be permitted to receive county solid waste. According to the current plan (2010), it is highly improbable that San Diego County would need to rely on the Campo landfill for its solid waste disposal needs well into the future.
14. EARTHQUAKE RISK
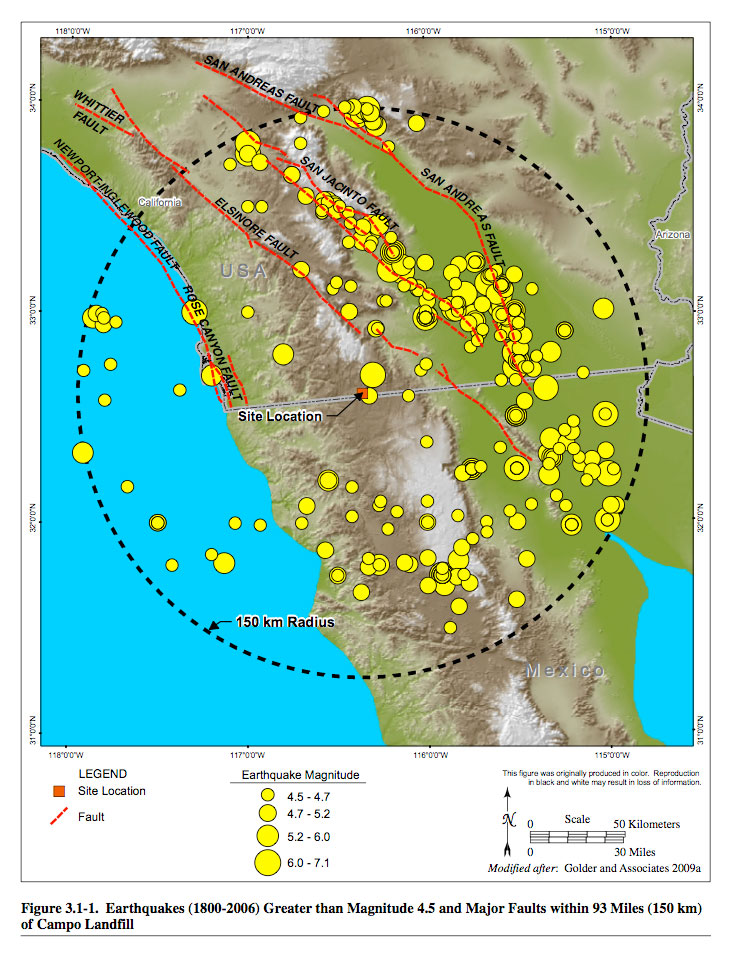
The vicinity of the Campo landfill site is transversed by several major faults, foretelling substantial tectonic activity. Figure 20 shows the recorded earthquakes with magnitudes greater than 4.5 within a 93-mile (150-km) radius from the proposed Campo landfill site (Bureau of Indian Affairs, 2010; p. 3.1-5).
|
Fig. 20 Earthquakes (1800-2006) greater than Magnitude 4.5 and major faults within 93 miles (150 km)
of the proposed Campo landfill (Bureau of Indian Affairs, 2010).
Largest earthquake in the region
The DSEIS states that the largest historical earthquake was a Richter 7.1 event that occurred on November 11, 1915, with its center located 89 miles southeast of the project site (Bureau of Indian Affairs, 2010; p. 3.1-4). Yet according to the U.S. Geological Survey, the February 24, 1892 earthquake in the Imperial Valley, California, about 50 miles east of the project site, was of magnitude 7.8.20
A description of the 1892 earthquake by the USGS Earthquake Hazards Program website is given below.18
"At the old Carrizo station in San Diego County, all adobe buildings were destroyed. In Paradise Valley, a church and schoolhouse built on stilts were knocked down and demolished; chimneys and plaster were broken in San Diego. Ground fissures were reported at McCain Valley and Jewel Valley; rockslides were observed between Campo and Carrizo and at Dulzura and Jewel Valley."
"About 155 tremors were felt at Campo during the 12 hours following the main shock, and aftershocks continued there every few days into April 1892. Observers reported that 135 aftershocks were felt as far away as National City, on San Diego Bay. Felt north along the coast to Santa Barbara, east to Yuma, Arizona, and south to San Quintin, Baja California. One report stated that the tremor was felt at Visalia, Tulare County, about 700 kilometers north of San Quintin."
Note that Jewel valley, where ground fissures and rock slides were reported, is about 4 miles NE of the proposed landfill site, while Campo is about 4 miles WNW.21 Thus, the neglect of the February 24, 1892 earthquake, the largest on record, is a serious omission of the DSEIS.
The DSEIS states that the intensity of the Maximum Credible Earthquake (MCE) ranges from 6.0 to 7.4 on the Richter scale, depending on the originating fault (Bureau of Indian Affairs, 2010; p. 3.1-6). Apparently, the 7.8 magnitude earthquake was not considered in the development of the adopted 6.0-7.4 MCE range.
April 4, 2010 earthquake in Baja California
The recent strong earthquake near Guadalupe Victoria, south of Mexicali, Baja California, on April 4, 2010, at 15:40 PDT, had an intensity of 7.2 on the Richter scale, making it one of the strongest on record. The epicenter was located about 75 miles southeast from the landfill site (Fig. 21).
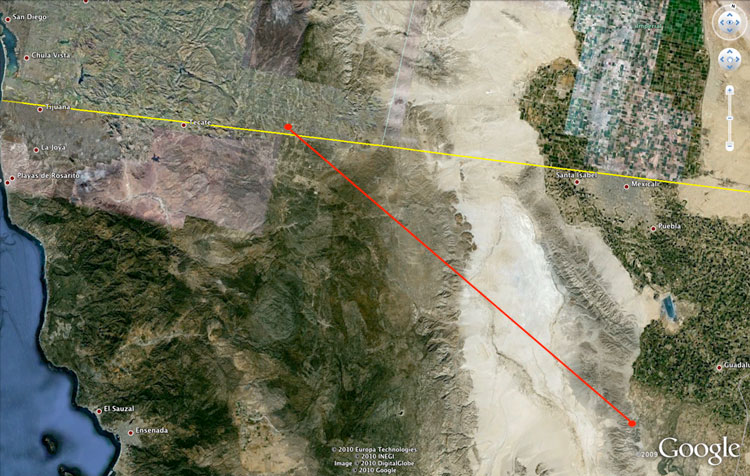 |
Fig. 21 Distance from the epicenter of the 7.2 magnitude earthquake on April 4, 2010 in Baja California,
to the Campo landfill site (click on figure to enlarge) (Source: Google Earth).
While structural damage was restricted to Mexicali and vicinity, including Calexico and El Centro, on the U.S. side of the border, the earthquake was felt throughout San Diego county, including Tierra del Sol, and as far as Phoenix and Las Vegas.22 The earthquake also cracked the main aqueduct that carries Colorado river water from Mexicali to Tijuana, leaving Tijuana residents severely limited in their water use.22
Figure 22 shows the Cucapah Range in Baja California during the earthquake, as seen from the Mexicali valley. This figure dramatically depicts the strong ground motion to which this range was subjected during the earthquake. The event has been recorded on video and posted on YouTube.23 The Cucapah Range is located approximately 50-65 miles southeast from the proposed Campo landfill.
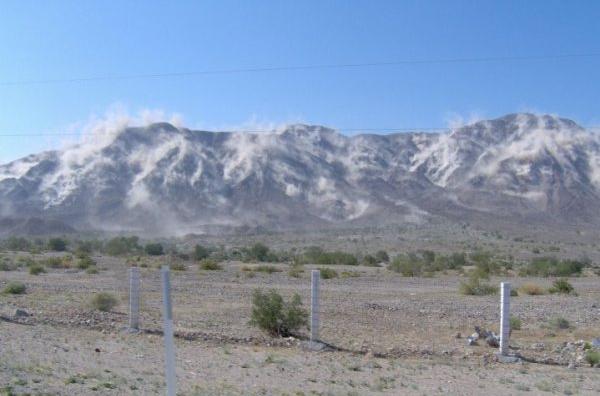
|
Fig. 22 The Cucapah Range, near Mexicali, Baja California,
being subjected to
strong ground motion during the April 4, 2010 earthquake.24
There are many examples of physical damage caused by the earthquake. Structural damage to a road and bridge approach in Mexicali is shown in Fig. 23. Structural damage to the Mexicali-Tijuana road at Km 20 near Cerro El Centinela, at a distance of 40 miles from the Campo landfill, is shown in Fig. 24
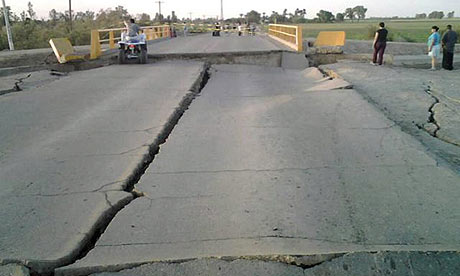
|
Fig. 23 Structural damage to road and bridge approach in Mexicali,
as a result of the April 4, 2010 earthquake.25
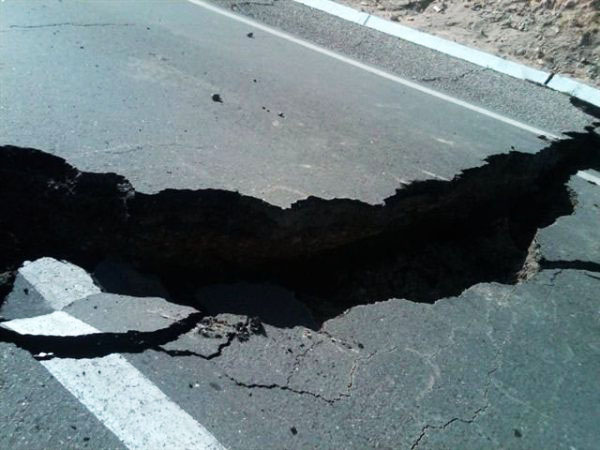
|
Fig. 24 Structural damage to the Mexicali-Tijuana road at Km 20, near Cerro El Centinela,
as a result of the April 4, 2010
earthquake.24
The Laguna Salada Fault
Recent photographs released by CICESE, in Ensenada, Mexico, show the extent to which the Pacific Plate moved against the North American Plate during the April 4th, 2010 earthquake (CICESE, 2010). A fracture about 0.4 m deep, 2 m wide, and 100 km long has been documented along the Laguna Salada Fault. This fault, a [probable] continuation into Mexico of the Elsinore fault in the United States, crosses the U.S.-Mexico border about 32 miles east of the proposed Campo landfill (see Fig. 20). Note that the February 24, 1892 earthquake, the strongest of record in the region, was caused by slippage along the Laguna Salada Fault.26
Earthquake increases groundwater pressure
The April 4th earthquake shook Southeastern San Diego County, with significant and measurable effects on its groundwater. A case in point is the Jacumba Hot Springs Spa and Lodge, about 8 miles east of the proposed Campo landfill. The facility is supplied by a well that furnishes hot, sulphurous water to its swimming pool and jacuzzis. As a direct result of the excessive water pressure released by the earthquake and two of its aftershocks, the well head blew out three times within a period of 24 hours and had to be repaired each time.27
A neighboring well, owned by the Jacumba Community Service District, has been flowing under artesian conditions since the April 4th earthquake. On April 17, the well was flowing at about 200 gallons per minute (Fig. 25). On April 24, the well was still flowing under artesian conditions at about 150 gallons per minute. By April 28, the flow had receded to about 35 gallons per minute.28
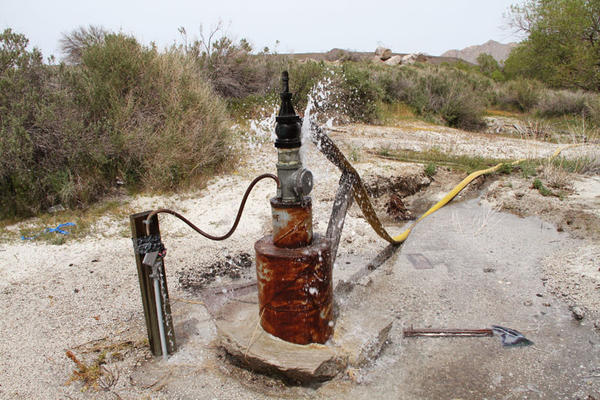
|
Fig. 25 Jacumba Water District's well head, flowing under artesian conditions
on April 17, 2010.
It is clear that the dynamic pressures generated by the earthquake have been significantly higher than the static pressures, and that it is taking several weeks for the pressures to recede back to normal. The earthquake shocks helped reset the fractures, and the water pressure in the aquifer increased accordingly. Clearly, the connection between strong earthquakes and changes in fluid pressure in fractured rock aquifers is too significant to be disregarded.
It is entirely possible that strong earthquakes such as that of April 4, 2010 may happen in the region within the expected 60 years of total project life (30-year operation plus 30-year post-closure monitoring period). Thus, the wisdom of placing a landfill: (1) on a fractured rock aquifer of uncertain characterization, (2) on the basin's headwaters where very intense storms are possible, (3) within close reach of the groundwater, and (4) in a region prone to major earthquakes, is highly questionable.
15. UNAVOIDABLE SIGNIFICANT IMPACTS
The DSEIS states that there are unavoidable significant impacts associated with the following:
- land use,
- resource use patterns (visual), and
- noise.
According to the DSEIS, no feasible measures exist to fully mitigate land use incompatibility impacts to several existing nearby residential, civic, and tribal land uses, as well as to nearby off-reservation residential land uses (Bureau of Indian Affairs, 2010, p. 5-2). Additionally, despite mitigation measures in place, visual impacts to off-reservation residences and noise levels will remain significant and unavoidable. The fact that these significant impacts cannot be mitigated casts questions on the project's viability.
Once completed, the landfill site will increase the average ground elevation by about 100 ft, as shown in
 |
Fig. 26 New ground level after landfill closure (click on figure to enlarge)
(Bureau of Indian Affairs, 2010).
The DSEIS fails to recognize an unavoidable and unmitigated significant impact to the water quality of neighboring private lands. It is only a matter of time before the liners will leak. It is almost impossible to implement appropriate monitoring in a fractured rock aquifer. In the event of contamination, water would have to be piped from long distances. The availability, quality, and cost of this water transfer has not been fully explained in the DSEIS.
16. TRANSBOUNDARY IMPACTS
The distance from the Campo landfill to the United States-Mexico border is about 0.8 miles.
The watershed immediately to the east of the site, delimited in red in
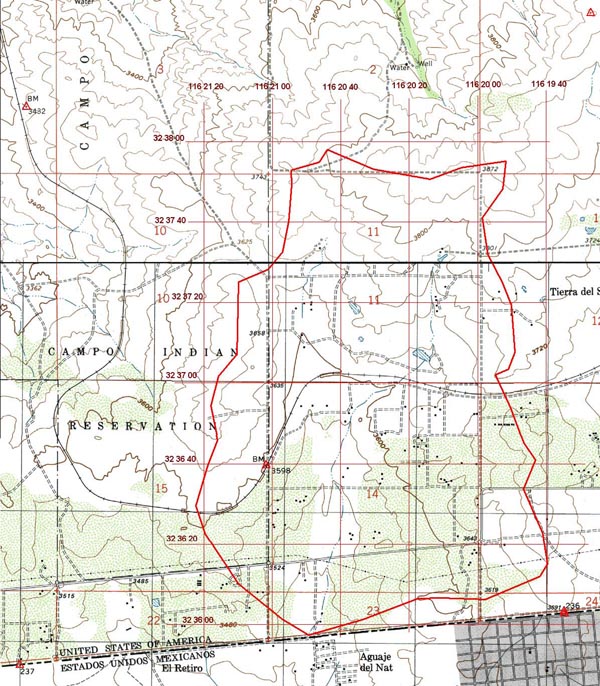
|
Fig. 27 Aguaje del Nat, crossing Roca Magisterial, and the community of Jardines del Rincon,
immediately south of the U.S.-Mexico border
(Ponce, 2006).
The DSEIS states that the potential for surface water contamination reaching Campo Creek and then being transported into Mexico is very small (Bureau of Indian Affairs, 2010; p. 7-3). Yet, the DSEIS does not address the potential for groundwater contamination reaching Mexico by leakage through and under the Tierra del Sol watershed.
Leakage originating in the landfill site is expected to make its way to the neighboring Tierra del Sol drainage through subsurface fractures and subsequently move downstream into Mexico. Thus, contaminant plumes from leaking liners, undetected by the scant number of monitoring wells, have a high probability of crossing the border within a relatively short time. Therefore, errors and omissions will have a transboundary impact.
Drainage to Mexico
There is absolute certainty that the springs in Aguaje del Nat originate from upstream sources in Tierra del Sol and vicinity. On April 8, 2010, a field inspection revealed that there are two gullies immediately south of the border, where Tierra del Sol creek drains into Mexico. The larger gully averaged 4 ft deep and 16 ft wide in places (Fig. 28), and the smaller one, about 3 ft deep and 6 ft wide. At a short distance downstream, the gullies join to form a small stream. On the day of the inspection, the flow of this stream was estimated at 8 gallons per minute (0.5 liters per second). The presence of a well and a small concrete dam and pond shows that the water in this stream has been or is being utilized for domestic consumption.
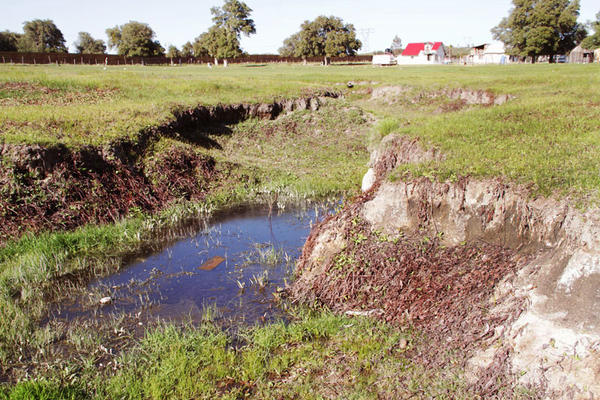
|
Fig. 28 Aguaje del Nat at Roca Magisterial,
immediately downstream
of the United States-Mexico border fence, shown in the background.
On June 20, 1994, the Mexican Embassy in Washington, D.C., issued Diplomatic Note No. 889, in reference to the planned installation of a municipal landfill in the Campo Indian reservation. The document states that contamination of the transboundary network of underground streams would create significant harm to the public health, particularly in the nearby community of Jardines del Rincon. Once the contamination has occurred, the inability to accurately predict its path precludes any guarantee that a contaminant plume that has penetrated the soil could be eliminated before, or even after, it enters the network of streams (U.S. Department of State, 1994).
The La Paz Agreement
It is noted that the Campo landfill project runs counter to existing binational agreements. In 1983, the United States and Mexico signed the La Paz Agreement on Cooperation for the Protection and Improvement of the Environment in the Border Area. The border area is defined as the 100-km strip of land adjacent to the physical border. The Campo landfill is clearly within this border area.
In Article 1 of the La Paz agreement, the U.S. and Mexico agree to cooperate in the field of environmental protection in the border area on the basis of equality, reciprocity, and mutual benefit. In Article 2, the parties agree to adopt the appropriate measures to prevent, reduce and eliminate sources of pollution in their respective territory which affect the border area of the other. Given the practical impossibility of an effective monitoring of a landfill entombment on top of a fractured rock aquifer, the Campo landfill project has yet to prove that it is technically sound and politically viable.
17. SUMMARY
FRACTURED ROCK AQUIFER
The siting of the Campo landfill on top of a fractured rock aquifer, barring appropriate characterization of the fractured rock system, and without adequate monitoring to prevent contaminant leakage beyond the landfill perimeter, threatens the quality of life of nearby residents, both on and off the reservation. No amount of reasonable monitoring can exclude the possibility of liner failure and subsequent groundwater contamination.
RISK OF CONTAMINATION
The proposed project may account for surface runoff; however, subsurface flow direction in a fractured rock aquifer defies characterization and absolute certainty. Thus, aquifer contamination remains a distinct possibility. Furthermore, liners, no matter how well constructed, do have a finite service life.
DIFFICULT REMEDIATION
The 30-year after-closure mandated monitoring period is too short to adequately protect residents from contamination of their water supply into the future. Once the groundwater has become contaminated, it will be very difficult to remediate. The contaminated water may tend to diffuse into the rock matrix's stagnant pore water, increasing the difficulty of cleanup. Another source of concern is the possible mobilization of chemical elements (such as arsenic) in the rock as a result of the biogeochemistry of the leachate plume.
INADEQUATE MONITORING
The absence of a detailed plan for east-side well monitoring for nearly two-thirds of the landfill footprint is a serious omission of the DSEIS. As currently conceived, the plan is expected to provide monitoring wells at a distance of about 500 feet on the east side. This is insufficient, and a cause for grave concern.
SOLE-SOURCE AQUIFER
The federal designation of the Campo-Cottonwood Creek aquifer, which includes the Tierra del Sol aquifer, as sole source, means that if this aquifer becomes contaminated, there are no reasonably available sources of water. Mitigation measures have promised to make up for this, but no feasible alternative sources have been identified. It is cost-prohibitive to import surface water to the region, even if it were available.
WASTE DIVERSION
For the past five years, since 2005, San Diego County has been implementing a program for waste diversion. Once the state-avowed target of 75% waste diversion is fully in place, the need for additional landfill space will be significantly reduced for the next several decades. According to the current plan, it is highly improbable that San Diego County would need to rely on the Campo landfill for its solid waste disposal needs well into the future. Therefore, to remain in business, the Campo landfill will have to import waste from much farther sources and, at that point, may have to consider receiving other types of wastes, including special wastes. All the while, its carbon footprint will be significantly increased, and the original plan--to receive municipal wastes--will be substantially altered.
EARTHQUAKE RISK
The neglect of the February 24, 1892 earthquake, of Magnitude 7.8, the largest on record, is a serious omission of the DSEIS. On this basis, the Maximum Credible Earthquake (MCE) may have to be recalculated. Note that strong ground motions can reset the pressure in the fractured rock aquifer, and can cause very large temporary increases in water pressure, as shown by the recent April 4, 2010 experience in the Jacumba Hot Springs Spa, about 8 miles east of the proposed Campo landfill. The well head blew out three times within a period of 24 hours and had to be repaired each time. It is clear that the dynamic pressures were significantly higher than the normal static pressures. A liner taking a direct hit will not be able to withstand these levels of pressure increases.
|
OVERALL ASSESSMENT
The siting of the proposed Campo landfill,
poses a high risk of contamination of groundwater, of difficult and costly mitigation.
Significantly, the conjunction of four natural geologic loads or hazards foretells of disasters waiting to happen.
Thus, the project presents a serious threat to the public health and safety of nearby residents, both on and off the Campo reservation, as well as to residents of
the neighboring Mexican communities of Roca Magisterial and Jardines del Rincon.
|
ENDNOTES
1
Tonalites and granodiorites are similar in mineral composition.
A tonalite is a plutonic (intrusive) rock where
the percentage of plagioclase feldspar, relative to the combined content of alkali and plagioclase feldspars,
is greater than 90;
in a granodiorite, the percentage varies between 65 and 90 (American Geological Institute, 1997).
2
The lineaments shown in this figure are based on a preliminary fracture map prepared by
Dames and Moore, Inc., the landfill's engineering consultant.
This fracture map was released by Kent Atkins, Mid-American Waste Systems hydrogeologist, in a letter
to Donna Tisdale dated March 11, 1991.
It is noted that the fracture map included in the Final Environmental Impact Statement (FEIS), dated November 1992 (Fig. 3.1-10),
shows only the longer or major lineaments.
3 Wieman, Deanna M. 1993.
Letter from the Environmental Protection Agency (EPA)
to Ronald M. Jaeger, Area Director, Bureau of Indian Affairs, Sacramento, California, January 4, 1993; 9 pages.
4
http://tc.engr.wisc.edu/uer/uer97/author4/index.html, visited April 18, 2010.
5 Huntley, D. 1993. Letter to Bob Morris, San Diego Regional Water Quality Control Board, January 10, 1993, p. 2 (6 pages).
6 Tisdale, D. 1993. Letter to Julian Granirer,
Project Geologist, Dames and Moore, February 1, 1991.
7 Tisdale, D. 1993. Letter to R. Jay Roberts,
Vice President, Mid-America Waste Systems, Inc., June 1, 1991, 2 pages.
8
http://legacy.signonsandiego.com/uniontrib/20070709/news_1n9statside.html , visited April 23, 2010.
9 According to J. T. Riedel and E. M. Hansen, of the Hydrometeorological Branch,
Office of Hydrology, NOAA National Weather Service, the August 12, 1891 Campo event
was the second most intense recorded point rainfall in the Intermountain Region of the United States (west of the Continental Divide).
http://iahs.info/redbooks/a106/iahs_106_0334.pdf, visited April 23, 2010.
10 Cited from Climatology of California, U.S. Department of Agriculture, Weather Bureau, Bulletin L, 1903, p. 224.
11 As reported in the Mountain Heritage,
Summer 1991 issue, Thomas L. Collins, U.S. Signal Officer stationed at Campo wrote c. 1891:
12 Letter from J. Eric Gibson, County Groundwater Geologist, to Donna Tisdale, Chair, Boulevard Planning Group,
dated March 8, 1993, with enclosures, including memo to file, table containing data, and related map (4 pages).
http://ponce.sdsu.edu/sandiego_county_tierradelsol_welldata_1993.html
13 For a list of leachate types, see
http://www.leachate.eu/leachate-types.php, visited April 14, 2010.
14 Buck, Byron M. 1993. Letter to Donna Tisdale, from Byron, M. Buck,
Executive Assistant to the General Manager, San Diego County Water Authority, San Diego, California, February 24, 1993, 2 pages.
15 Released by Wayne Williams, San Diego County Department of Public Works,
as public information on April 14, 2010.
16 California jurisdictions
will be required to divert 75% of their waste from landfill beginning January 1, 2015
if Senate Bill 420 becomes law; some jurisdictions are optimistic about achieving this rate, others are not.
Quoted from http://www.raymond.com/state/14_4/news/2627-1.html
on April 14, 2010.
17 Special waste is defined as any waste material which,
because of its physical characteristics, chemical makeup, or biological nature requires either special handling procedures and permitting,
or poses an unusual threat to human health, equipment, property, or the environment. http://www.specialwaste.info
18
http://eur-lex.europa.eu/LexUriServ/LexUriServ.do?uri=CELEX:31999L0031:EN:NOT, visited April 22, 2010.
19
http://en.wikipedia.org/wiki/Waste_Implementation_Programme , visited April 22, 2010.
20
http://earthquake.usgs.gov/earthquakes/states/events/1892_02_24.php, visited April 14, 2010.
21
Jewel valley is located 4.37 miles NE of the proposed Campo landfill site, and
Campo is 4.46 miles WNW (Source: Google Earth).
22 The San Diego Union-Tribune, Monday, April 5, 2010.
23 YouTube, accessed April 27, 2010.
24 Photo courtesy of the State Government of Baja California, received April 6, 2010.
25
http://www.guardian.co.uk/world/2010/apr/05/earthquake-california-mexico, for April 5, 2010.
26
http://en.wikipedia.org/wiki/Laguna_Salada_Fault
27 As told by Alfred Tischler, manager of the Jacumba Hot Springs and Spa, during the site visit of April 17, 2010.
28 As confirmed by Tom Lindenmeyer, general manager of the
Jacumba Community Service
District, during the telephone interview of April 28, 2010.
29 In Mexican Spanish,
"aguaje" refers to a spring where water flows perennially or intermittently (Source: Alberto Castro, Tijuana).
REFERENCES
American Geological Institute. 1997. Glossary of Geology. Julia A. Jackson, editor, Alexandria, Virginia.
Bureau of Indian Affairs. 2010. Draft Supplemental Environmental Impact Statement for the proposed Campo Regional Landfill Project.
Department of
the Interior, 26 February 2010, http://campodseis.com.
Campo Indian Reservation. 1992a. Draft Environmental Impact Statement, Campo Solid Waste Management Project, San Diego County, California,
February.
Campo Indian Reservation. 1992b. Final Environmental Impact Statement, Campo Solid Waste Management Project, San Diego County, California,
November. http://campodseis.com/pdfs.
CICESE. 2010. Photos of the ground displacement at the Laguna Salada Fault, in Baja California,
as a result of the April 4, 2010, 15:40 PDT earthquake with epicenter near Guadalupe Victoria, south of Mexicali.
Centro de Investigación Científica y de Educación Superior de Ensenada, Baja California, Mexico, April 28. http://ponce.sdsu.edu/earthquake_1004041540.html
Cook, P. G. 2003. A guide to regional groundwater flow in fractured rock aquifers. CSIRO Land and Water, Glen Osmond, South Australia.
http://lwa.gov.au/files/products/river-landscapes/px020312/px020312.pdf, visited April 14, 2010.
County of San Diego, California. 2010. Five-year Review of County Integrated Waste Management Plan 2010. Department of
Public Works, in progress (expected release by September 2010).
GeoSyntec Consultants. 2004. Landfill Facility Compliance Study, Task 6 Report: Review of
MSW Landfill Regulations from Selected States and Countries. GeoSyntec Consultants, Oakland, California, August.
http://www.p2pays.org/ref/34/33332.pdf, visited April 23, 2010.
Jeffers, P., and V. Wittig. 2004. Fractured bedrock aquifer hydrogeologic characterization for a bioaugmentation pilot study.
Contaminated Site Clean-Up Information, Environmental Protection Agency, Technology Innovation Program.
http://www.clu-in.org/products/siteprof/2004fracrockconf/cdr_pdfs/indexed/group1/148.pdf , visited April 22, 2010.
Mutch, R. D., J. I. Scott, and D. J. Wilson. 1993. Cleanup
of fractured rock aquifers: implications of matrix diffusion.
Environmental Monitoring and Assessment, Springer Netherlands, Vol. 24, Number 1, January 1993, visited April 16, 2010.
Ponce, V. M. 2005. Flood hydrology of Tecate Creek, Tecate, Baja California, Mexico.
Web report.
http://ponce.sdsu.edu/tecate_creek_flood_hydrology_report.html
Ponce, V. M. 2006. Impact of the proposed Campo landfill on the hydrology of the Tierra del Sol watershed.
Web report. http://tierradelsol.sdsu.edu
Shapiro, A. M. 2001. Characterizing groundwater chemistry and hydraulic properties of fractured-rock
aquifers using the multifunction bedrock-aquifer transportable testing tool (BAT3).
U.S. Geological Survey Fact Sheet FS-075-01, 06 May 2006, 4 p.
http://toxics.usgs.gov/pubs/FS-075-01, visited April 16, 2010.
Visualab Productions. 2009. Tierra del Sol fights for clean water. Webvideo.
http://ponce.sdsu.edu/eonvideo/tierradelsol_1M.html
U.S. Department of State. 1994. Fax Transmittal, from Colleen Smith, from EPA, to Donna Tisdale, 8 pages.
U.S. Geological Survey. 2008. Landfill leachate mobilizes arsenic bound in aquifer sediments: Saco, Maine.
Toxics Program Remediation Activities, Toxic Substances Hydrology Program.
http://toxics.usgs.gov/topics/rem_act/saco.html, visited April 16, 2010.
"...It was running over and the reservoir was nearly half full.
I emptied it out of the gage and did not stop to measure the reservoir.
After the shower was over, I went out to measure the water and the gage was gone, carried off by the flood..."
http://comments.sdsu.edu
PDF file
Print file
100505