|
|
|
DRAFT ENVIRONMENTAL IMPACT STATEMENT
SHU'LUUK WIND PROJECT
CAMPO INDIAN RESERVATION, CALIFORNIA
COMMENTS - WATER ISSUES
Victor M. Ponce
13 February 2013
|
This document provides comments to the Draft Environmental Impact Statement (DEIS), Shu'luuk Wind Project,
Campo Indian Reservation, San Diego County, California.
This document is limited to comments on the water issues of the project, including water demand, water supply,
and groundwater sustainability.
The proposed project involves the construction, installation and operation of 54 to 85 wind turbines
to generate electricity, with the actual number to depend on the alternative selected. One of the alternatives
includes a 300-acre solar farm.
The review and analysis of the subject DEIS with regard to water issues
enables the following conclusions:
The maximum water demand is 107 ac-ft/yr for the construction period.
To assure a sustainable yield, only 39 ac-ft/yr of this demand may be supplied from the local aquifer.
The difference, amounting to 68 ac-ft/yr,
will have to be supplied from other sources.
The DEIS fails to identify
the various sources, amounts, and sustainability of off-reservation imported water needed to meet project requirements.
The potential for well interference or well interruption is not addressed.
The impact of construction-period blasting and wind turbine vibrations on the groundwater
fractures, yield, and quality of neighboring wells, both on and off
the reservation, has not been adequately addressed in the DEIS.
Other issues such as cumulative impacts, sole-source aquifer realities,
and transboundary effects are not adequately addressed in the DEIS.
The use of water in the region is likely to change substantially when industrial-scale projects start to share
the already scarce resource. The issue boils down to who has priority of usage.
On this matter, the DEIS is significantly silent, failing to even acknowledge the existence of a problem or to analyze it properly,
let alone make an attempt to mitigate it.
A Supplemental DEIS is needed to correct existing information gaps and provide an adequate basis for informed decision making.
|
1. INTRODUCTION
|
|
1.1 Scope
This document provides Comments to the Draft Environmental Impact Statement (DEIS), Shu'luuk Wind Project, Campo Indian Reservation, San Diego County, California (AECOM 2012a). The DEIS was released at the end of December 2012. The 45-day period for public comment closes February 25, 2013. This document is submitted on February 13, 2013.
This document is limited to comments on the water issues of the project, including water demand, water supply, and groundwater sustainability.
1.2 Project description
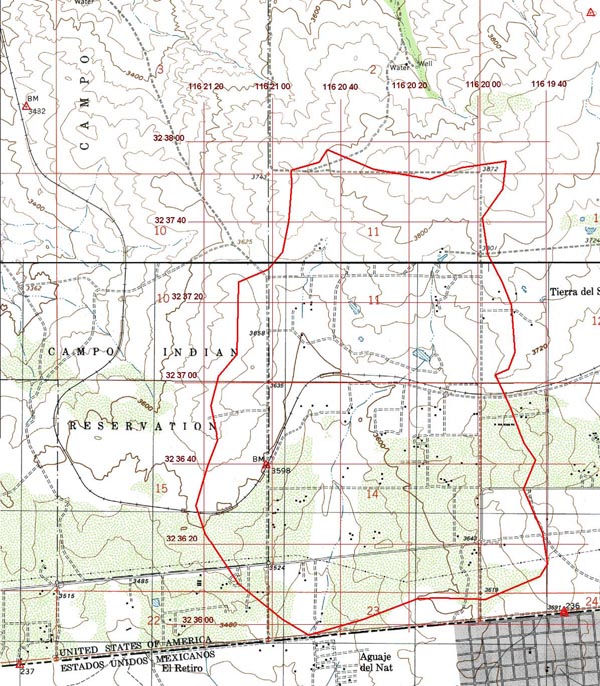
The Bureau of Indian Affairs (BIA), in cooperation with the Campo Band of Mission Indians of the Kumeyaay Nation, have initiated the Environmental Impact Statement (EIS) for the proposed Shu'luuk Wind Project, located on the Campo Indian Reservation in southeastern San Diego County. The proposed project consists of the construction and operation of a commercial wind energy generation facility within the confines of the reservation (Fig. 1). The project is to be leased to Invenergy Wind, LLC (Invenergy), a private company.
The proposed project involves the construction, installation and operation of 54 to 85 wind turbines to generate electricity, the actual number to depend on the alternative selected. Ancillary physical features of the project include: (1) a substation, (2) up to 5 miles of new transmission lines, (3) aproximately 25 miles of new access roads, and (4) an O&M building.
Three alternatives have been identified:
- 250 MW of wind energy
- 160 MW of wind energy plus 40 MW of solar energy (300 acres)
- 160 MW of wind energy.
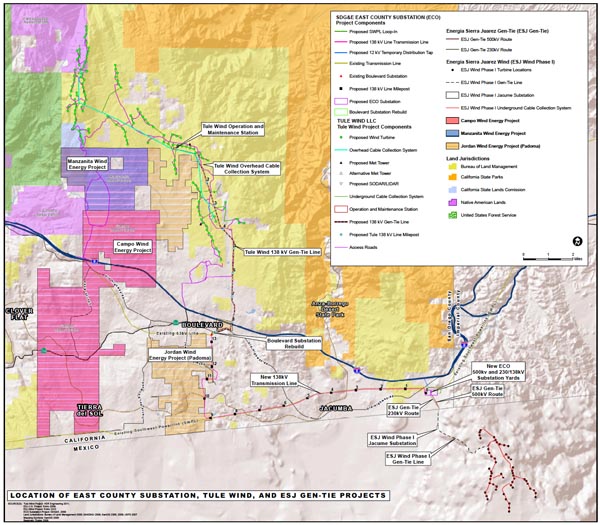
Concurrent with the Shu'luuk Wind project, SDG&E is planning to upgrade the existing interconnection transmission line between the Campo reservation boundary and the Boulevard Substation. The upgrade is described in the DEIS as a connected project. Other substations include a solar project substation (not included in the DEIS), a new Boulevard Substation, and a new East County (ECO) Substation (Fig. 2).
|
| Source: California Public Utilities Commission. |
Fig. 2 Location of East County (ECO) Substation and other energy projects (Click to enlarge).
2. WATER DEMAND
|
|
2.1 Construction-period water demand
The project will require the expenditure of substantial amounts of water, to be used during construction, for activities such as soil compaction, concrete mixing, and dust suppression. For each alternative, the amount of water demand will vary temporally with the project stage, either during:
- Peak construction, the first three months,
- Non-peak construction, following the first three months, and
- Near construction completion.
The project construction is expected to last 11 to 13 months, depending on the alternative chosen
(AECOM 2012a).
Table 1 summarizes the proposed water demand during the construction period.
| Table 1. Proposed water demand during the construction period. | |||||||
| Alternative [1] |
Timing of usage [2] |
Demand (gpd) a [3] |
Demand (ac-ft/mo) [4] |
Duration (mo) [5] |
Demand (ac-ft) [6] |
Demand (ac-ft/yr) [7] |
|
| 1 | a | Peak construction | 124,300 | 11.44 | 3 | 34.32 | |
| b | Non-peak construction | 74,300 | 6.84 | 7 b | 47.88 | ||
| c | Near construction completion | 61,500 | 5.66 | 3 b | 16.98 | ||
| Total duration and demand | 13 | 99.18 | 91.55 | ||||
| 2 |
A. For the wind component, the same as Alternative 3. | ||||||
| B. For the solar component, the water demand has not been stated in the DEIS. c | |||||||
| 3 | a | Peak construction | 123,900 | 11.41 | 3 | 34.23 | |
| b | Non-peak construction | 73,900 | 6.80 | 5 b | 34.00 | ||
| c | Near construction completion | 61,500 | 5.66 | 3 b | 16.98 | ||
| Total duration and demand | 11 | 85.21 | 85.21 | ||||
|
a Data taken from AECOM 2012b. b Estimate based on AECOM 2012b. c The absence of any mention of the water use of the solar component of Alternative 2 is a significant omission of the DEIS (AECOM 2012a). | |||||||
2.2 Long-term water demand
The long-term water demands, applicable for the project life (25 years, with a possible extension to 35 years), consist of the following:
- Residential water demands, and
- Project operational water demands.
Estimates of these amounts are shown in Table 2. Note that the amounts shown in this table refer only to the study area, and
do not include adjacent off-site and transboundary water users.
| Table 2. Long-term water demand in the study area. a, b | ||||
| Item [1] | Description [2] |
Number of households [3] |
Demand, per household (ac-ft/yr) [4] |
Total demand (ac-ft/yr) [5] |
| - | Residential ⇒ Current | 12 | 0.5 | 6 |
| 1 | Residential ⇒ Future (by builtout) | 30 | 0.5 | 15 |
| 2 | Operational demand (Shu'luuk Wind Project) | 0.2 | ||
| Total long-term water demand (residential plus operational): 1 + 2 | 15.2 | |||
|
a Data from AECOM 2012b.
b Does not include adjacent off-site and transboundary water users. | ||||
2.3 Total water demand
The total water demand, including construction-period demand and long-term residential and operational demands, are summarized in Table 3.
| Table 3. Total water demand in the study area. a, b | ||||
| Component [1] |
Type of demand [2] |
Alternative 1 (ac-ft/yr) [3] |
Alternative 2 (ac-ft/yr) [4] |
Alternative 3 (ac-ft/yr) [5] |
| 1 | Construction-period demand | 91.55 | 85.21 | 85.21 |
| 2 | Long-term residential and operational demands | 15.2 | 15.2 | 15.2 |
| Total water demand: 1 + 2 | 106.75 | 100.41 | 100.41 | |
|
a Data from AECOM 2012b.
b Does not include adjacent off-site and transboundary water users. | ||||
3. WATER SUPPLY
|
|
3.1 Water sources
The water demand is projected to be satisfied from the following sources (AECOM 2012b):
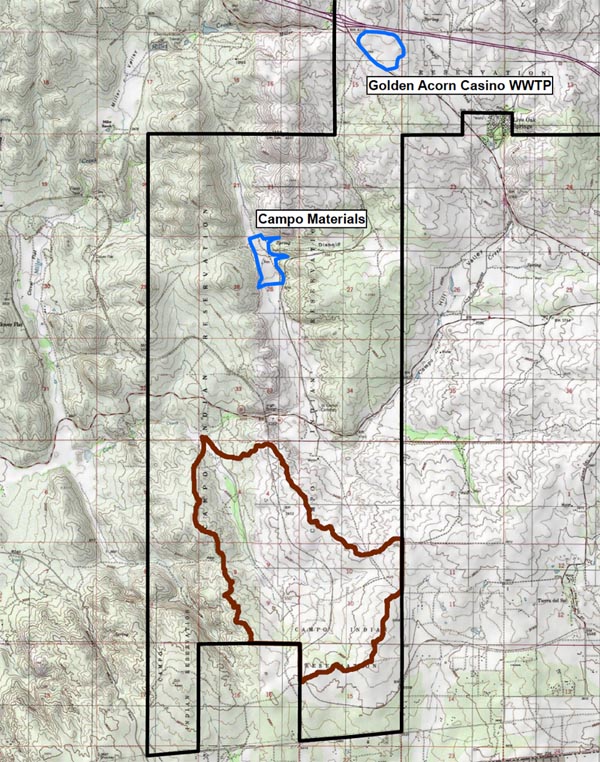
Local groundwater from two (2) production wells located in the southeastern portion of the reservation, with a total of 70,000 gpd. For this purpose, a study subbasin (tributary of Campo Creek) encompassing the two production wells has been identified (Fig. 3). This subbasin, delineated in burgundy color, has a drainage area of 1,691 acres;
Treated wastewater from the Golden Acorn Casino wastewater treatment plant, labeled as WWTP and delineated in light blue in Fig. 1, with a total of 150,000 to 300,000 gpd, subject to an appropriate check on the quality of the effluent;
Water purchased from Campo Materials (Fig. 3); and
Off-reservation sources.
|
Fig. 3 Delineation of study subbasin (in burgundy), Golden Acorn Casino (light blue),
and Campo Materials (light blue), within the Campo Indian reservation
(in dark gray) (AECOM, 2012b).
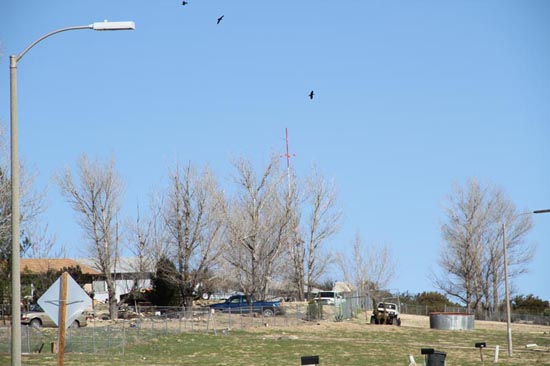
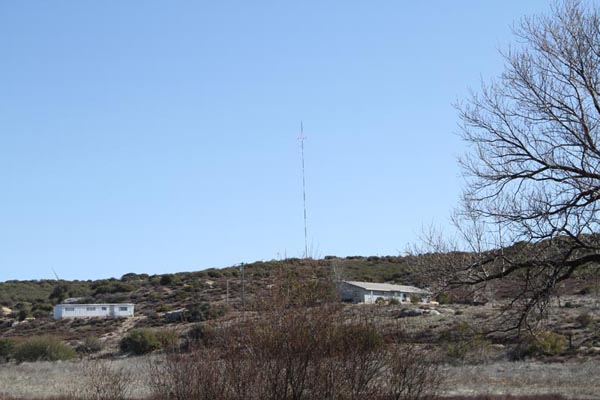
The project plans to use groundwater from two wells, as shown in Table 4. These wells are within 20 ft of each other (Fig. 4), therefore,
it is estimated that well interference will result in a combined capacity of 50 gpm (AECOM 2012b). This data is based on previous studies; therefore,
updated well testing is needed to reflect current aquifer conditions.
| Table 4. Study area well information. a | |||
| Well No. [1] | Designation [2] |
Depth (ft) [3] |
Capacity (gpm) [4] |
| 1 | HG-31 | 140.5 | 40 |
| 2 | HG-60 | 300.0 | 25 |
| a Data from AECOM 2012b. | |||
|
Fig. 4 The two wells to be tapped for groundwater (February 1, 2013).
The water available to pump from the two wells is:
| Available well pumping volume: 50 gpm = 80 ac-ft/yr |
According to the DEIS, as much as 50% of the water needed during the first three months would need to be supplied
by alternative sources, including Golden Acorn casino, Campo Materials, and off-reservation sources (AECOM 2012b).
A detailed analysis of alternative sources of water, including type, origin, quantity and quality, is missing from the DEIS.
3.2 Mean annual volume of water
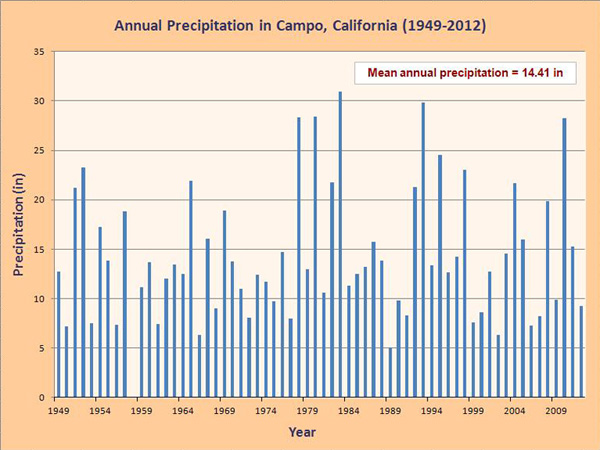
The study area has been estimated to be in the rainfall belt of 15-18 in of mean annual precipitation (AECOM 2012b). In this document, the mean annual precipitation was calculated based on the existing record for the Campo gage, spanning the period 1949 to 2012. The record of annual precipitation is shown in Fig. 5. The mean annual precipitation for the period of record is 14.41 in.2 Annual precipitation at the Campo gage has varied from a low of 5.07 inches in 1989 to a high of 30.94 inches in 1983.
|
Fig. 5 Annual precipitation in Campo, California (1949-2012).1
The mean annual volume of water originating in precipitation in the study area is:
| Volume = Basin area × precipitation depth Volume = 1,691 ac × 14.41 in / (12 in/ft) = 2,031 ac-ft. |
This amount is the mean annual volume of water available in the study area. In the prevailing semiarid chaparral ecosystem, most of this amount goes to satisfy evaporation and evapotranspiration. A small fraction (less than 10%) is usually considered as [gross] recharge to groundwater (AECOM 2012b). However, it should be noted that under equilibrium conditions, [gross] recharge equals discharge (Alley et al. 1999; Ponce 2007).
| Net recharge to groundwater = [Gross] recharge - discharge |
Under these conditions, net recharge to groundwater is effectively zero.
| Net recharge to groundwater = 0 |
For practical applications, the sustainable yield amount is limited to a suitable small fraction of the [gross] recharge (Section 4).
4. SUSTAINABLE YIELD
|
|
4.1 Groundwater recharge
Calculations of groundwater recharge are customarily undertaken to assess groundwater resource potential (AECOM 2012b). Usually, these calculations focus on the recharge portion of the groundwater flux, and express mean annual recharge as a percentage of mean annual precipitation. However, these calculations are flawed, because they fail to recognize that groundwater is not a volume, but a flux, and that the existence of recharge presupposes the existence of discharge (Sophocleous 1997; Bredehoeft 1997). In many instances, this discharge may have already been committed to other uses, including natural (ecosystemic, including wetlands) and human-induced (agriculture, urban, industrial).
Notwithstanding the fact that net groundwater recharge is effectively zero, it is recognized that the groundwater industry has a history of many decades of gross recharge calculations, with the controversy remaining unsettled to this date, in spite of the many authoritative references in support of the concept [that net recharge is equal to zero] (Theis 1940; Kazmann 1956; Prudic and Herman 1996; Alley et al. 1997; Ponce 2012). Thus, following standard hydrogeologic practice, the Shu'luuk Wind Project DEIS calculates and reports a mean annual gross recharge of 1.37 in (AECOM 2012b). With mean annual precipitation equal to 14.41 in (Fig. 4), this value of recharge (1.37 in) amounts to 9.5% of mean annual precipitation.3
| Mean annual [gross] recharge = (1.37/14.41) × 100
Mean annual [gross] recharge = 9.5% of mean annual precipitation |
Using this value of recharge, as stated in the DEIS (AECOM 2013b), the mean [gross] recharge to groundwater (ac-ft/yr) in the study area is:
| Mean [gross] recharge = [Recharge (%) × Volume (ac-ft/yr)] / 100 Mean [gross] recharge = [9.5% × 2,031 ac-ft/yr]/100 = 193 ac-ft/yr |
The choice of an appropriate recharge percentage is crucial for the water balance and for the assessment of groundwater sustainability and, therefore, it merits further elaboration. Recharge is indeed a percentage of precipitation, but the amount is not fixed, having a tendency to vary with precipitation itself, that is, with the type of climate, from arid to semiarid to subhumid to humid. It can be shown that wetter climates have larger amounts of recharge than drier climates (Ponce et al. 1997). While global values of recharge are estimated to be about 18% to 20% of precipitation, in semiarid San Diego County the recharge percentage is, in all probability, much smaller.
For instance, Scanlon et al. (2006) have performed a global synthesis of groundwater recharge in semiarid and arid regions, using approximately 140 study areas, including the U.S. Southwest. They report values of recharge varying between 0.1% and 5.0% of mean annual precipitation. Thus, the value of recharge calculated in the DEIS (1.37 in, amounting to 9.5% of precipitation) appears to be too high. An updated calculation is needed.
4.2 Sustainable yield
Sustainable yield follows from the principle that all human activities must strive to remain sustainable, i.e., the proposed development activities or actions should meet the needs of the present generation without compromising the ability of future generations to meet their own needs (World Commission on Environment and Development, 1987). While this definition is all-encompassing, it has particular application to natural resources that are held in common. Groundwater is a perfect example of a public commons; it is there for everybody to use, but not to abuse; recall the Tragedy of the Commons (Hardin 1968; Glennon 2004).
In a comprehensive U.S. government report, Alley et al. (1999) defined sustainable yield as the amount of pumping that can be maintained for an indefinite time without causing environmental, social, or economic consequences. Notably, Bredehoeft (1997) has argued -- in a Ground Water editorial, on November 1997 -- that sustainable yield has almost nothing to do with hydrogeologic recharge [see also, Sophocleous 2000].
The fallacy of attempting to pump 100% of the gross recharge is well recognized. Enlightened strategies of groundwater management define sustainable yield as a suitable percentage of the gross recharge, even though there is no relation between them. However, in practice there is still limited experience as to how to determine sustainable yield as a percentage of gross recharge (Ponce, 2007).
Maimone (2004), among others, has recognized that there is no fixed number applicable to all cases, and that the actual number is subject to adaptive management (Maimone, 2004; Seward et al. 2006). A value of 10% appears to be conservative, while a value of 30% is probably close to the practical upper limit (Ponce, 2007). Detailed basin interdisciplinary studies are required to determine an appropriate value, which remains responsive to environmental, social, and economic constraints (Alley et al. 1999).
In the absence of detailed hydrologic studies, a working value of sustainable yield may be selected as 20% of gross recharge.
Since gross recharge is 193 ac-ft/yr, a working value of
sustainable yield is:
| Working value of sustainable yield = (20% × 193 ac-ft/yr) / 100
Working value of sustainable yield = 39 ac-ft/yr |
Table 5 shows a summary of the evaluation. It is concluded that 68 ac-ft/yr will have to be supplied from
sources other than groundwater in the study-area aquifer.
| Table 5. Summary of the evaluation. | ||
| Unit [1] |
Description [2] |
Volume (ac-ft/yr) [3] |
| a | Maximum water demand | 107 |
| b | Maximum amount of water available in study-area aquifer | 39 |
| c | Amount to be satisfied from other sources (a - b) | 68 |
As stated, the evaluation is applicable to the mean annual precipitation (14.41 in). The record shows that annual precipitation in the 64-yr period (1949-2012) has ranged from a minimum of 5 inches in 1989 to a maximum of 30.94 inches in 1983 (Section 3.2). Monitoring of precipitation during the construction period will be necessary to assess whether the adopted working value of sustainable yield (39 ac-ft/yr) is either too high or too low.
5. OTHER IMPACTS
|
|
5.1 Rock aquifer
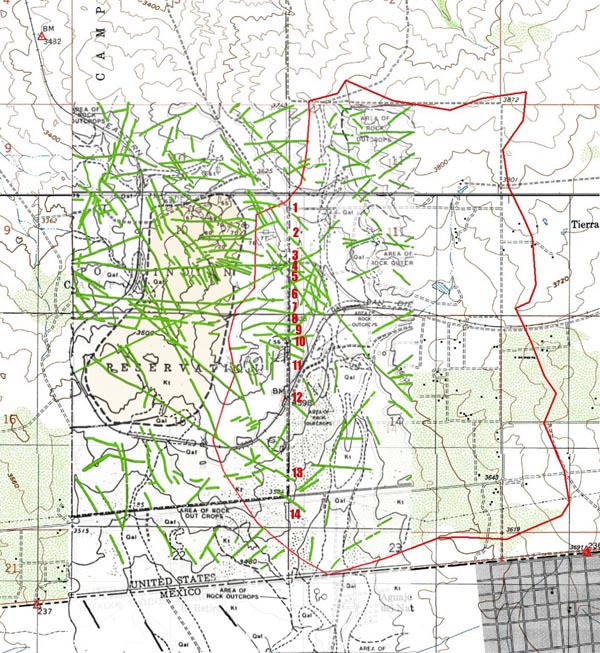
The Shu'luuk Wind project site is underlain by a rock aquifer of difficult characterization. The rocks are extensively fractured, due either to batholith cooling or tectonic uplift. Previous studies have revealed the considerable extent of the fractures in the vicinity of the proposed Shu'luuk Wind project site (Ponce 2006). These fractures provide underground connections and preferential flow paths between the Shu'luuk Wind project site and neighboring watersheds.
Many of the identified fracture alignments cross the landfill site in a predominantly west-east direction. At least fourteen (14) fracture alignments cross the boundary between the Campo Indian reservation and privately owned land immediately east of it (Fig. 6). The DEIS lacks an updated assessment as to the extent of these fracture systems and their effect on the groundwater flow patterns. In addition, the potential for off-site impacts to existing wells, springs, seeps, and riparian vegetation are not adequately addressed in the DEIS (AECOM 2012b).
|
Fig. 6 Geologic fractures identified in the vicinity of the Shu'luuk Wind project site (Ponce 2006).
5.2 Blasting and vibration effects
The construction and operation of the Shu'luuk Wind Project will have a negative effect on the underlying rock aquifer and local wells due to blasting and vibration. Continuous dynamic loading of the aquifer may produce unexpected or unpredictable changes in water pressure in the wells.
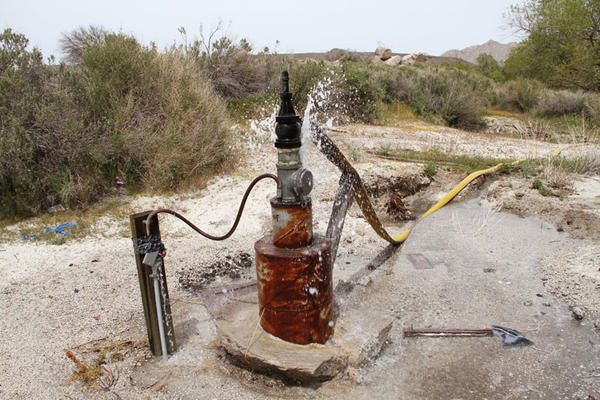
A local example of dynamic loading is represented by the events following the April 4th, 2010 earthquake, which shook Southeastern San Diego County.4 A well at the Jacumba Hot Springs Spa and Lodge blew out three times within a period of 24 hours and had to be repaired each time. A neighboring well, owned by the Jacumba Community Service District, flowed under artesian conditions for several weeks after the earthquake (Fig. 7). The vibrations produced by the earthquake loading helped reset the fractures, and the water pressure in the aquifer increased accordingly (Ponce 2010).
|
Fig. 7 Jacumba Water District's well head, flowing under artesian conditions on April 17, 2010.
The effects
of construction blasting and turbine vibration on the underlying rock aquifer, on and off the reservation, have not been adequately addressed in the DEIS.
5.3 Oil spillage and hazardous materials management
The DEIS does not include an analysis of possible oil spills, their negative impact on groundwater quality, and proposed remediation strategies. Experience with wind energy facilities indicates that each wind turbine can hold up to 200 gallons of mineral oil coolant, each turbine transformer up to 500 gallons, and a wind substation up to 12,000 gallons (U.S. Bureau of Land Management 2012). Details of hazardous materials storage, spill and accident avoidance, emergency response strategies, remediation, and hazardous materials management are missing from the DEIS.
5.4 Cumulative impacts
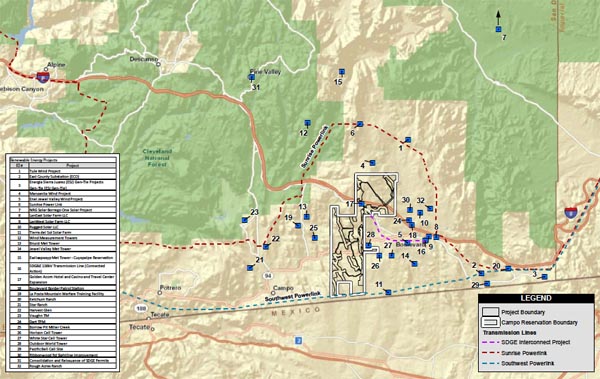
The Shu'luuk Wind project is one of several [alternative] energy projects being planned in the San Diego backcountry, in and around the community of Boulevard (Fig. 8) (AECOM 2012a). The aggregate impact of all these projects to the natural, aesthetic, and other resources of these rural communities has not been fully addressed. Many of these projects will require substantial amounts of water which, if obtained onsite or from local water districts, will have to tap the underlying aquifer. A partial list of these projects and their estimated water demands is shown in Table 6.
|
Fig. 8 Other projects planned in the vicinity of Shu'luuk Wind Project
(Click to enlarge).
| Table 6. Energy projects and their water demands.a | ||
| Project [1] |
Title [2] |
Water demands (million gallons) [3] |
| 1 | Kumeyaay Wind b | Unknown |
| 2 | Tule Wind | 19 |
| 3 | Jewel Valley Wind | Unknown |
| 4 | Shu'luuk Wind | 21 |
| 5 | Shu'luuk Wind Gen-Tie | 2.3 |
| 6 | Energia Sierra Juarez Wind Gen-Tie | 0.78 |
| 7 | Manzanita Wind | Unknown |
| 8 | Soltec Rugged Solar | 24 |
| 9 | Soltec Tierra del Sol Solar | 26 |
| 10 | Soltec LanEast Solar | 7.15 |
| 11 | Soltec LanWest Solar | 19.5 |
| 12 | Sol Orchard Boulevard | 6.4 |
| 13 | Eco and Boulevard Substations | 30 |
| 14 | Rough Acres Camp and Rock Crushing c | 8.8 |
| Total cumulative water demand d | 164.93 | |
|
a Source: Donna Tisdale, Chair, Boulevard Planning Group.
b Existing project. c Not an alternative energy project; included here for completeness. d Unknown amounts are excluded from the total shown in Column 3. | ||
The total cumulative water demand, excluding the unknown entries, is 164.93 million gallons, which is equivalent to 506.15 ac-ft.
| Total cumulative water demand = 164,930,000 gallons
Total cumulative water demand = 506.15 ac-ft |
The Shu'luuk Wind Project plans to pump groundwater from two wells located within the reservation limits (Table 4). Possible well interference with other wells, both inside and outside the reservation, is not addressed in the DEIS. Well pumping, together with that of other wells to be used for other projects in the vicinity, is likely to tax the local aquifer beyond its sustainable yield (Section 4.2).
The Shu'luuk Wind project will have to rely on additional power substations and related power infrastructure needed to move the energy from the Campo reservation to the SDG&E power grid. These include the new Boulevard Substation and the new East County (ECO) substation (Fig. 2). The DEIS fails to address the cumulative water consumption of these related projects.
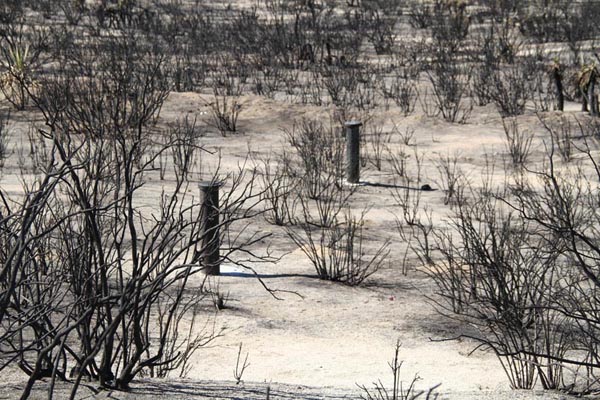
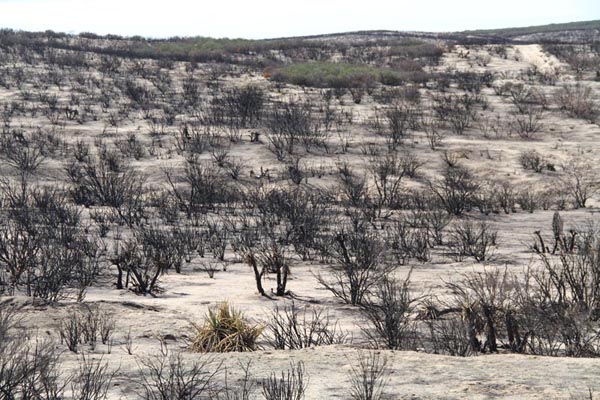
The Shu'luuk Wind Project site is located on Campo tribal land, within San Diego County. Therefore, it is subject to the wildfire hazard common to its geographical and climatic setting. The recent Shockey fire of September 23, 2012, which burned 2,556 acres in Tierra del Sol and vicinity, is a stark reminder of the risk of intensive development of this area (Fig. 9). 5
|
5.5 Campo-Cottonwood Sole-Source Aquifer
The entire Shu'luuk Wind project footprint is located within the federally designated Campo-Cottonwood Sole-Source Aquifer.6 An aquifer can be named a Sole-Source Aquifer by the Administrator of the Environmental Protection Agency if the aquifer supplies 50% or more of the drinking water for an area and there are no reasonably available alternative sources should the aquifer become contaminated (Ponce 2010). The area overlying the Campo-Cottonwood aquifer has no access to surface water; therefore, it is entirely reliant on groundwater, which is limited by its own nature (Section 4.2).
The Shu'luuk Wind Project plans to use large amounts of transformer coolant oil (Section 5.3). No provisions are contemplated in the DEIS in case of an accidental oil spill and subsequent leakage into the underlying aquifer. Every San Diego County rural community east of Alpine is dependent on groundwater, including Campo, Boulevard, Live Oak Springs, Tierra del Sol, Jacumba, and Pine Valley.
5.6 Transboundary impacts
The DEIS does not state explicitly the possible transboundary surface and groundwater impacts of the project and their mitigation. Yet the distance from the Shu'luuk Wind Project to the U.S.-Mexico border is actually less than one mile (AECOM 2012a).
In particular, the 40 MW solar project footprint (Alternative 2) will lie partially within the Tierra del Sol watershed (Fig. 10) (Ponce 2006). Underlying water-bearing fractures, documented in Fig. 6, help redirect the flow toward the Tierra del Sol aquifer. The Tierra del Sol watershed and its aquifer drain south into Mexico through Aguaje del Nat, about 0.6 miles west of the community of Jardines del Rincón. The latter is the shaded gray area at bottom right of Fig. 10. The flow at Aguaje del Nat has been estimated at 8 gpm in April 2010 (Ponce 2010).
|
Fig. 10 Tierra del Sol watershed, draining into Aguaje del Nat, near the community of Jardines del Rincón,
immediately south of the U.S.-Mexico border (Ponce 2006).
6. SOCIAL ASPECTS
|
|
6.1 The folly of intensive development of the desert
The DEIS fails to properly recognize and mitigate the cumulative impacts imposed by intensive desert development and the consequent tapping of the limited water resources of the region [See Water Follies for an authoritative treatise on the impacts of runaway groundwater development (Glennon 2004)]. There is no significant surface-water storage in the study area or region; therefore, surface water cannot be relied on as a resource for large-scale industrial consumption (Section 5.4). Over the years, the rural communities of San Diego East County have been forced to depend entirely on groundwater for their survival (Section 5.5).
Despite its long history of exploitation, groundwater has proven to be a fragile resource: Technically, it does not even exist, because net recharge is effectively zero (Section 4.2). In semiarid regions, even gross recharge may be a relatively small percentage of precipitation (Section 4.1). Thus, whether the available groundwater supply is taken either as: (1) a percentage of precipitation [gross recharge], or (2) a percentage of recharge ["sustainable yield"], the actual amount available for use is likely to be indeed very small (Section 4.2).
Historically, the rural communities of eastern San Diego County have made limited use of the water resources of the region. The use of water in the region is likely to change substantially when industrial-scale projects start to share the already scarce resource (Section 5.4). The issue boils down to who has priority of usage. On this matter, the DEIS is patently silent, failing to even acknowledge the existence of a problem or to analyze it properly, let alone make an attempt to mitigate it.
6.2 The "Hard Look" Doctrine
The National Environmental Policy Act (NEPA) states that, to the fullest extent possible, all federal agencies shall utilize a systematic, interdisciplinary approach which will insure the integrated use of the natural and social sciences in planning and decision-making which may have an impact on the environment (Sec. 102 [42 U.S. 4332]). Accordingly, the Shu'luuk Wind DEIS must contain a detailed study of all adverse environmental effects which cannot be avoided should the project be implemented (Fig. 11). The study must include the relationship between projected short-term uses and the maintenance and enhancement of long-term productivity, that is, the pursuit of sustainability.
Over the years since the enactment of NEPA (1969), the U.S. courts have interpreted the requirement for a detailed study as the need for a "hard look" at project-induced environmental impacts (U.S. Department of Agriculture 2009).
7. CONCLUSIONS
|
|
7.1 Conclusions
The review and analysis of the Draft Environmental Impact Statement for the Shu'luuk Wind Project (AECOM 2012a) with regard to water issues enables the following conclusions:
The maximum total water demand is 107 ac-ft/yr for the construction period. To assure a sustainable yield, only 39 ac-ft/yr may be supplied from the local aquifer. The difference, amounting to 68 ac-ft/yr, will have to be satisfied from other sources.
The DEIS fails to identify the various sources, amounts, and sustainability of off-reservation imported water needed to meet project requirements. The potential for well interference or interruption is not addressed.
The impact of construction-period blasting and wind turbine vibrations on the groundwater fractures, yield, and quality of neighboring wells, both on and off the reservation, has not been adequately addressed.
Other issues such as the cumulative impact of many industrial-scale projects in the region, Campo-Cottonwood sole-source aquifer realities, and transboundary effects remain to be properly addressed.
The use of water in the region is likely to change substantially when industrial-scale projects start to share the already scarce resource. The issue boils down to who has priority of usage. On this matter, the DEIS is significantly silent, failing to even acknowledge the existence of a problem or to analyze it properly, let alone make an attempt to mitigate it.
7.2 Recommendations
This review has identified a number of shortcomings of the DEIS for the Shu'luuk Wind project. Pointedly, the issue of groundwater sustainability remains to be adequately addressed to the satisfaction of many concerned stakeholders. A Supplemental DEIS is needed to correct significant information gaps and provide an adequate basis for informed decision making. The need for a Supplemental DEIS is in consonance with the requirement of study detail mandated by NEPA (Section 6.2).
ACKNOWLEDGEMENTS
|
|
The author wishes to acknowledge the support of Donna Tisdale and the people of the community of Boulevard, in Eastern San Diego County. The assistance of Rosa D. Aguilar, San Diego State University civil engineering graduate student, is also gratefully recognized.
ENDNOTES
|
|
1 Campo, California: Monthly Total Precipitation (inches) (041424), Western Regional Data Center, Desert Research Institute, Reno, Nevada (accessed on 28 January 2013).
http://www.wrcc.dri.edu/cgi-bin/cliMONtpre.pl?ca1424
2
The analysis excludes the year 1958, for which no records are available.
3
The calculated mean annual [gross] recharge reported in the DEIS, equal to 1.37 inches, amounting to 9.5% of
mean annual precipitation, appears too high when compared to recent regional experience (Scanlon et al. 2006).
4
The April 4, 2010 earthquake had its epicenter
near Guadalupe Victoria, south of Mexicali, Baja California, about 75 miles southeast from the Shu'luuk Wind project site.
Its intensity was 7.2 on the Richter scale, one of the strongest on record.
5
The Shockey fire of September 23, 2012 burned 2,556 acres in Tierra del Sol and vicinity.
The fire destroyed 11 residences, 14 outbuildings, and 11 vehicles. There was one civilian fatality (Shockey fire video).
6
The Campo-Cottonwood Creek Sole-Source Aquifer was designated as such on May 5, 1993, under the authority of Section 1424(e) of the Safe Drinking Water Act (Federal Register Citation-49 FR 2948, January 24, 1984).
7
A meteorological tower is a tall, tubular steel tower, secured via four sets of guy wires, which connect from the tower
at several heights to anchors on the ground.
The wind speed and direction are measured using anemometers for the wind speed and wind vanes for the direction.
REFERENCES
AECOM. 2012a. Draft Environmental Impact Statement, Shu'luuk Wind Project, Campo Indian Reservation, San Diego County,
California, December.
AECOM. 2012b. Groundwater resource evaluation, Shu'luuk Wind Project, Campo Reservation, Campo, San Diego County,
California, December.
Alley, W. M., T. E. Reilly, and. O. E. Franke. 1999. Sustainability of ground-water resources.
U.S. Geological Survey Circular 1186, Denver, Colorado, 79 p.
Bredehoeft, J. 1997. Safe yield and the water budget myth. Editorial, Ground Water, Vol. 35, No. 6, November-December, 929.
Glennon, R. J. 2004. Water Follies: Groundwater pumping and the fate of America's fresh waters. Inland Press.
Hardin, G. 1968. The Tragedy of the Commons. Science, Vol. 162, 1143-1148.
Kazmann, R. G. 1956. "Safe yield" in ground water development: Reality or illusion? Journal of the Irrigation and Drainage Division, American Society of Civil Engineers, Vol. 82, No. IR3, November, Paper 1103.
Maimone, M. 2004. Defining and managing sustainable yield. Ground Water, Vol. 42, No. 6, November-December, 809-814.
Ponce, V. M., A. K. Lohani, and P. T. Huston. 1997. Albedo and water resources: Hydroclimatological impact of human activities. Journal of Hydrologic Engineering, ASCE,
Vol. 2, No. 4, October, 197-203.
Ponce, V. M. 2006. Impact of the proposed Campo landfill on the hydrology of the Tierra del Sol watershed: A reference study. Online report.
Ponce, V. M. 2007. Sustainable yield of groundwater. Online report.
Ponce, V. M. 2010. Draft Supplemental Environmental Impact Statement for the proposed Campo Regional Landfill
Project: Comments. Online report.
Ponce, V. M. 2012. Thompson Creek Groundwater Sustainability Study. Online report.
Prudic, D. E., and M. E. Herman. 1996. Ground-water flow and simulated effects of development in Paradise Valley, a basin tributary to the Humboldt River, in Humboldt County, Nevada.
U.S. Geological Survey Professional Paper 1409-F.
Scanlon, B. R., K. E. Keese, A. L. Flint, L. E. Flint, C. B. Gaye, W. M. Edmunds, and I. Simmers. 2006.
Global synthesis of groundwater recharge in semiarid and arid regions. Hydrological Processes, 20, 3335-3370.
Seward, P., Y. Xu, and L. Brendock. 2006. Sustainable groundwater use, the capture principle, and adaptive management. Water SA, Vol. 32, No. 4, October, 473-482.
Sophocleous, M. 1997. Managing water resources systems: Why "safe yield" is not sustainable. Editorial, Ground Water, Vol. 35, No. 4, July-August, 561.
Sophocleous, M. 2000. From safe yield to sustainable development of water resources - The Kansas experience. Journal of Hydrology, Volume 235, Issues 1-2, August, 27-43.
Theis, C. V. 1940. The source of water derived from wells: Essential factors controlling the response of an aquifer to development. Civil Engineering, Vol 10, No. 5, May, 277-280.
World Commission on Environment and Development (The Brundtland Commission). 1987. Our Common Future. The United Nations, New York.
|
 About the author About the author
Dr. Victor M. Ponce has taught hydrology at San Diego State University since 1980. He has more than forty (40) years of experience in the water resources field. His extensive record of research and practice may be viewed at ponce.sdsu.edu |
| http://shuluuk.sdsu.edu | PDF file |
|
130313 14:30 |