|
|
|
|
A hydrologic study has been performed with the objective of ascertaining flood peak discharges and related hydrographs for Tecate Creek at Tecate, Baja California, Mexico. The study underpins ongoing studies to restore Tecate Creek to productive stability. The aim is to assure adequate flood conveyance, while preserving and enhancing related hydroecological, socioeconomic, and aesthetic functions. The hydrologic model RAINFLO, developed at San Diego State University, has been used for these studies. The model subdivides the basin into twentysix (26) subbasins and converts distributed event precipitation into flood runoff following established hydrologic practices. Flood peaks and discharges are calculated for the following return periods: 2, 5, 10, 25, 50 and 100 yr. In addition, the Gumbel method is used to extend the set of modeled peak discharges to the return periods of 200, 500, 1000, 2000, 5000, and 10,000 yr. The 10-yr flood peak, i.e., the regulatory flood, is Q10 = 268 m3s-1; the 500-yr flood peak, i.e., the design flood, is Q500 = 997 m3s-1; and the 10,000-yr flood peak, i.e., the probable maximum flood, is Q10,000 = 1499 m3s-1. |
1. INTRODUCTION
[Background]
[Methodology]
[Data Collection]
[Results]
[Conclusions]
[References]
•
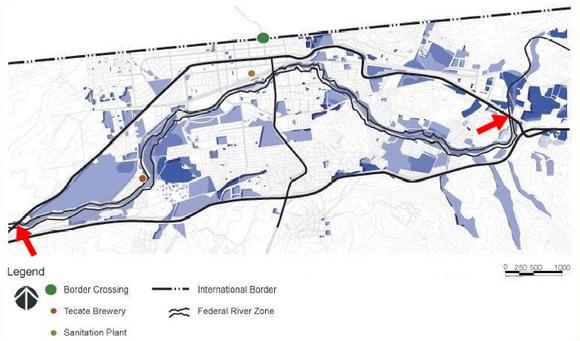
Tecate Creek, in Tecate, Baja California, Mexico (Figure 1), is being considered by local, state, and federal agencies for rehabilitation. The project
encompasses about 11.5 km of Tecate Creek, from the upstream end at Puente San Jose II, east of Tecate proper, to the downstream end at
Puente La Puerta, west of Tecate (Figure 2). It is expected that the project will be executed in phases over the next twenty years,
as resources become available.
The rehabilitation project seeks to provide a host of natural and anthropogenic functions to restore Tecate Creek to
productive stability. Several functions will be enhanced by the rehabilitation project.
These are: (1) flood conveyance, (2) groundwater replenishment,
(3) compliance with federal stream-zoning regulations, (4) preservation of the riparian corridor, (5) enhancement of water quality,
and (6) establishment of open areas for parks, sports and recreation, including landscaping and aesthetics.
The project is of strategic binational importance, since Tecate Creek forms part of the Tijuana river basin,
which straddles the U.S.-Mexican border along the states of California and Baja California.
The hydrologic system constituted by Campo-Tecate Creek
has its headwaters near Live Oak Springs, in Eastern San Diego County [California], and flows past [the town of] Campo into Mexico.
There it changes name, first to Cañada
Joe Bill, and then to Arroyo Tecate (Tecate Creek). Thus, the hydrologic fate of Tecate Creek and its contributing
watershed is intertwined with that of Campo Creek, on the U.S. side
of the border.
A comprehensive study of Tecate Creek requires an assessment of the flood hydrology, which underpins hydraulic,
river mechanics, riparian vegetation and related studies. Thus, this report focuses on the flood hydrology of Tecate Creek, as the point-of-start
of a project aimed at river rehabilitation and restoration. In essence, the flood hydrology study
refers to the assessment of flood peak discharges and related
hydrographs under a wide range of return periods, from the 2-yr return period, i.e, the mean annual flood,
to the 10,000-yr return period, to be taken in lieu of the Probable Maximum Flood.
Given the dearth of streamflow data for Tecate Creek, the study focuses on rainfall-runoff modeling
as a means of developing flood hydrographs.
|
2. BACKGROUND
[Methodology]
[Data Collection]
[Results]
[Conclusions]
[References]
•
[Introduction]
The Comisión Nacional del Agua (CNA) [National Water Commission of Mexico],
the Secretaría de Infraestructura y Desarrollo Urbano (SIDUE) [Department of Intrastructure and Urban Development of Baja California],
and the Ayuntamiento de Tecate [Municipality of Tecate] are three federal, state, and local
government agencies, respectively, with jurisdiction over Tecate Creek.
Previous studies have been performed by Rhoda Arkhos Ingeniería S.C. [the "Rhoda Arkhos" study], the
California State Polytechnic University Pomona Studio 606 (the "Pomona" study), and the Centro de Estudios Sociales y Sustentables, in Tijuana
(the "CEUSS" study) (Rhoda Arkhos Ingenieria S.C. no date; Centro de Estudios Sociales y Sustentables 2004).
Other relevant studies have been completed by Huffman & Carpenter Inc. and San Diego State University's Institute of Regional Studies of the Californias.
The Rhoda Arkhos study is entitled "Estudio Hidrológico del Río Tecate"
[Hydrologic Study of Tecate Creek]. The study uses precipitation data for two neighboring stations ("La Puerta" and "El Hongo")
and the streamflow data for the gaging station at Arroyo Alamar, about 40 km downstream, in neighboring Tijuana.
It calculates hyetograph abstraction and generates unit hydrographs following established hydrologic practices.
The main limitation of this study is that only one NRCS runoff curve number (CN) was estimated for the entire basin.
This renders the calculation lumped, rather than distributed.
A distributed computation is more appropriate for Tecate Creek, which features
a drainage area in excess of 400 km2.
Furthermore, the estimated value (CN = 50) is judged to be too low, given the accumulated
body of related experience on both sides of the U.S.-Mexican border.
For reference purposes,
the Rhoda Arkhos study estimated the 100-yr flood peak for Tecate Creek as Q100 = 169
The Pomona study is entitled "A Framework for an Urban River Environment: Tecate, Mexico."
As such, it makes significant strides toward the development of a landscape-architecture vision for Tecate Creek.
A conceptual plan for the future of Tecate is formulated, ostensibly with Tecate Creek as the plan's backbone.
The study regards the river as a focal element on which to base urban development.
Design guidelines are prepared to show how the river and its environs can be effectively incorporated into the city's footprint.
The CEUSS study is entitled "Programa Parcial de Mejoramiento de la Zona Río Tecate" [Partial Program for Improvement of the Tecate River Zone].
The study is a planning instrument designed to provide the framework for strategic planning, as it refers to the future development,
rehabilitation, and restoration of Tecate Creek and its surroundings.
At this juncture, a comprehensive model-based flood hydrology study is needed for Tecate Creek (Figure 3). The limitations of the Rhoda Arkhos report
having been outlined, the next step is to perform a flood hydrology study founded on the improved modeling techniques that have become
available in routine hydrologic engineering practice over the past twenty years.
The specific tool is event rainfall-runoff modeling featuring distributed catchment parameterization.
This includes distributed formulations of
precipitation, hydrologic abstractions, rainfall-runoff transforms, reservoir and channel routing, and channel transmission losses,
in the context of a generalized topological structure. Based on the availability of depth-duration-frequency (DDF) precipitation data,
the catchment modeling can be performed for 2-yr to 100-yr return periods.
Once these values are established, extensions up to the 10,000-yr return period
can be developed using the widely accepted Gumbel extreme-value probability function (Ponce 1989).
|
3. METHODOLOGY
[Data Collection]
[Results]
[Conclusions]
[References]
•
[Introduction]
[Background]
The study will perform event distributed rainfall-runoff modeling on Tecate Creek and its contributing watershed/basin [Campo-Tecate Creek watershed].
The aim is to ascertain flood peaks and related discharge
hydrographs for 2-yr to 100-yr return periods.
The model chosen for this study is RAINFLO,
developed by the senior writer at San Diego State University.
This in a distributed event rainfall-runoff computer model similar in structure to the U.S. Army Corps of Engineers' HEC-1 and HMS models.
The model generates event runoff [flood] hydrographs when presented with a set of initial and boundary conditions and the
appropriate geometric and physiographic characteristics.
The basin is divided into several subbasins for purposes of distributed catchment network modeling.
For each subbasin,
the characteristics include drainage area, hydraulic length, land slope, channel slope,
soil type, land use and treatment type, hydrologic surface condition, and antecedent moisture condition.
The model has five main computational modules: (1) precipitation, (2) hydrologic abstraction,
(3) rainfall-runoff transform, (4) reservoir and channel routing, (5) and channel-transmission losses.
In addition, the model features a generalized topological structure, which enables it to
accept distributed watershed/basin data belonging to a complex dendritic network of any order. This considerably simplifies the modeling of
basin networks and allows the modeler to concentrate on the correct model parameterization.
In particular, the capability to model channel transmission losses (USDA Soil Conservation Service 1983)
sets this model apart from conventional hydrologic models
such as HEC-HMS, which currently does not have this capability (HEC-HMS 2004).
The model's generalized topological structure allows it to consider two types of watersheds/subbasins: (1) upland, and (2) reach.
An upland subbasin must always drain into a reach subbasin (therefore, the name "upland").
However, a reach subbasin may receive drainage from either an upland subbasin or another reach subbasin.
Each subbasin, upland or reach, performs the following tasks: (1) receives total precipitation input,
(2) abstracts total precipitation into effective precipitation, (3) transforms effective precipitation into runoff, and (4) expresses the
runoff [flood] hydrograph at the subbasin's most downstream point. However, unlike the upland subbasin, the reach subbasin
has the capability to perform reservoir and/or stream channel routing along the [longitudinal] channel reach; therefore, the name "reach" subbasin.
In addition, the reach subbasin can perform channel transmission losses to abstract flows in influent streams,
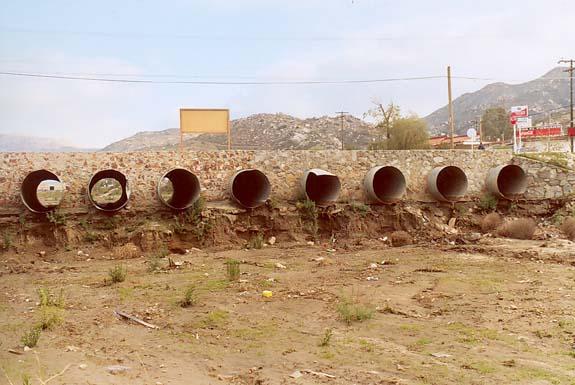
such as those that prevail in the U.S. Southwest (USDA Soil Conservation Service 1983) (Figure 4).
In RAINFLO, the precipitation input is specified for each subbasin as a depth value (cm) for a given storm. Typically, one of four USDA NRCS 24-hr storms (I, IA, II or III) is chosen for modeling purposes (Ponce 1989). In this case, storm Type I is applicable to the coast and mountains of Southern California. The depth-duration-frequency precipitation data is obtained from applicable NOAA NWS isopluvial maps (NOAA National Weather Service 1973). The hydrologic abstraction is performed with the USDA NRCS runoff curve number methodology (Ponce 1989). This method abstracts total event precipitation (P) into effective event precipitation, or runoff (Q), following a conceptual model of hydrologic abstraction developed by Victor Mockus and his associates in the 1950's (Ponce 1996). The abstraction procedure is based on four watershed characteristics: (1) hydrologic soil type (either A, B, C, or D); (2) land use and/or treatment (agriculture, range, forest, or urban); (3) hydrologic surface condition (good, fair, or poor), and (4) antecedent moisture condition (wet, average, or dry) (Ponce 1989). The rainfall-runoff transform is performed with the unit hydrograph methodology, wherein a hydrograph for a "unit" (1 cm) storm is developed for each subbasin, and later convoluted with the effective storm pattern to arrive at the flood hydrograph, at each subbasin outlet. The subbasins of the Campo-Tecate Creek watershed are generally less than 100 km2. Therefore, the USDA NRCS dimensionless unit hydrograph is considered appropriate to describe the runoff-diffusion characteristics of the predominantly hilly terrain of the Campo-Tecate Creek watershed (Figure 5). The stream-channel routing is performed with the Muskingum-Cunge method (Cunge 1969; Ponce 1978). Unlike the conventional Muskingum method (Chow 1959), which bases its routing parameters [K and X] on hydrologic streamflow measurements [effectively requiring gaged streams], the Muskingum-Cunge method bases its routing parameters [C and D] on geometric data [cross-section dimensions] and hydraulic data [channel slope and rating curve]. This makes the Muskingum-Cunge method very predictive, particularly for ungaged watersheds such as that of Campo-Tecate Creek (Ponce 1989). The channel transmission losses are modeled with a control-volume mass balance, abstracting the routed streamflows using the Muskingum-Cunge source/sink [lateral inflow/outflow] routing coefficient C3 developed by Ponce (1986). The reach-average infiltration velocity is estimated based on soil characteristics and used in the channel routing including channel transmission losses (USDA Soil Conservation Service 1983).
|
4. DATA COLLECTION
[Results]
[Conclusions]
[References]
•
[Introduction]
[Background]
[Methodology]
The data collection is divided into six phases:
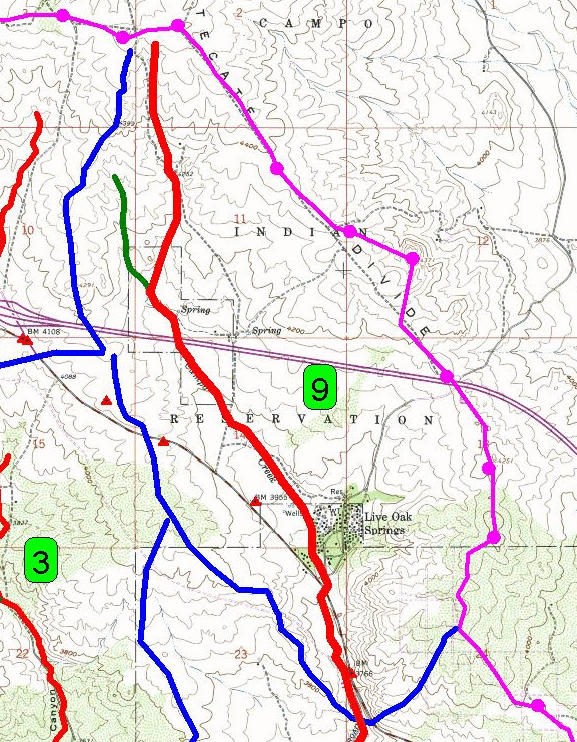
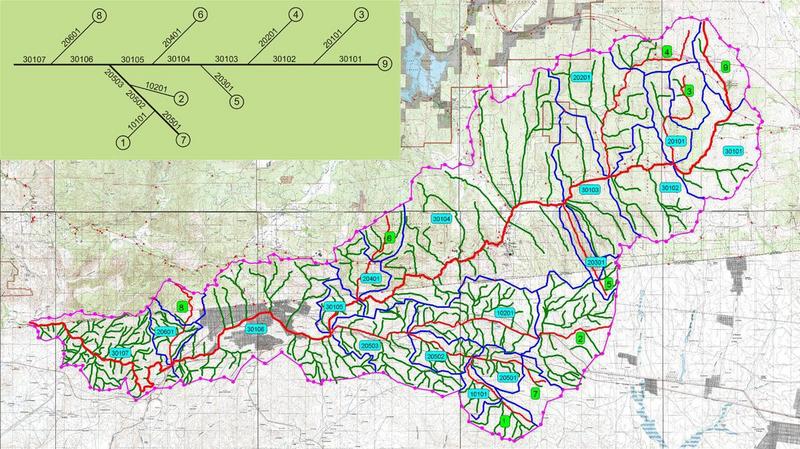
The chosen topology for the Campo-Tecate Creek watershed is shown in Figure 6. The U.S.-Mexican border is the straight line that divides the watershed/basin from east to west. The basin is divided into nine (9) upland subbasins (Example: Miller Creek, upland subbasin 4) and seventeen (17) reach subbasins (Example: Tecate Creek, reach subbasin 30106). Using computer software tools, the subbasins are delineated following the peaks and saddles in the topography. A complete set of maps of the subbasin delineation is given by Ponce (2005a). |
|
| Figure 6. Basin topology and subbasin delineation for the Campo-Tecate watershed. |
|
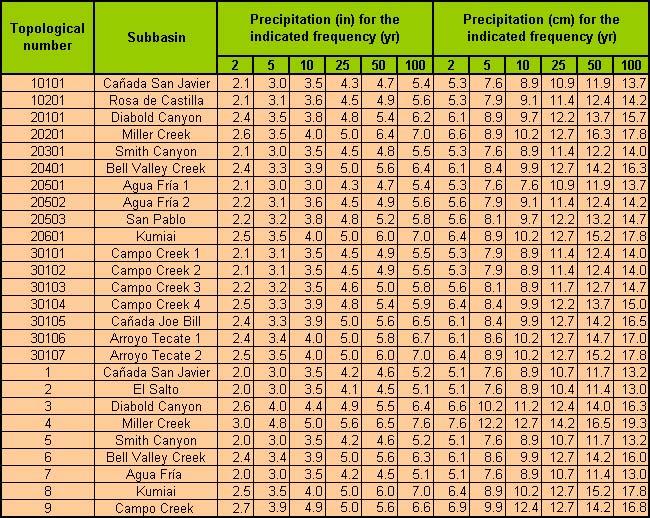
The precipitation value (in or cm) for 2- to 100-yr frequencies was obtained from NOAA Precipitation Atlas 2 (California) (NOAA National Weather Service 1973). The isopluvial curves were extended to cover the portion of the subbasins lying on the Mexican side of the border. An average precipitation value was expressed at the centroid of each subbasin. The results are shown in Figure 7.
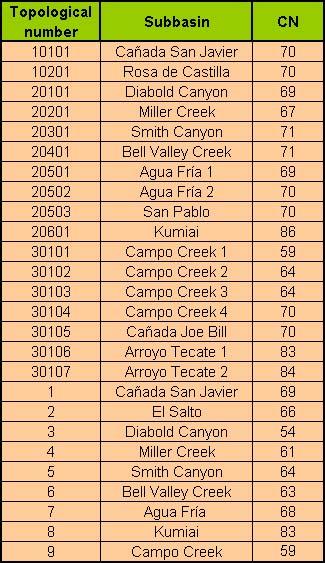
The subbasin curve numbers, corresponding to average antecedent moisture condition, or AMC II, were obtained following the procedures established in the San Diego County Hydrology Manual (San Diego County 2003). Hydrologic soil-cover complexes were determined for each subbasin using an appropriately sized square-grid pattern, and a curve number was determined at every grid intersection. For each subbasin, the curve number is the spatially weighted value. The curve numbers for subbasins on the Mexican side of the border were estimated based on the subbasins' proximity and hydrological similarity with their U.S. counterparts. Aerial imagery and field reconnaisance were used to aid in this extension. The results are shown in Figure 8.
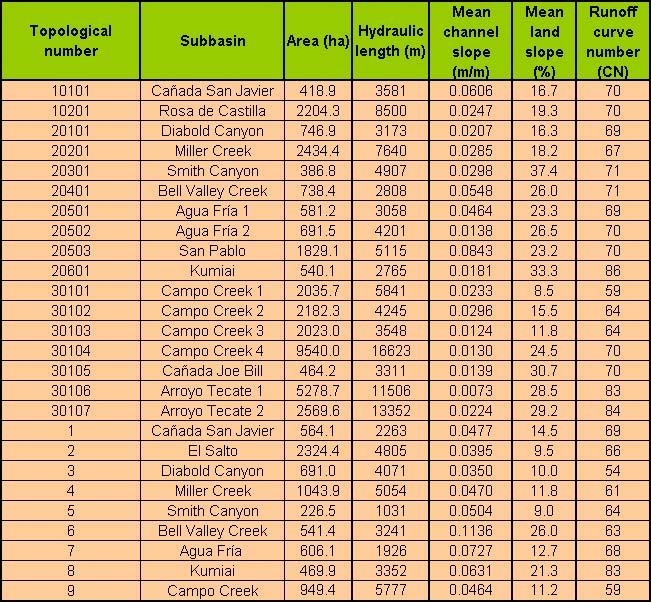
The rainfall-runoff transform is performed by means of the convolution of the unit hydrograph with the effective storm pattern. The chosen unit hydrograph is the NRCS dimensionless unit hydrograph (USDA SCS 1972). For subbasins up to 16 km2 (1600 ha), the catchment lag is based on three subbasin characteristics: (1) hydraulic length, (2) mean land slope, and (3) runoff curve number. The hydraulic length was measured from topographic maps (Ponce 1989). The mean land slope was obtained as the average of a set of values obtained from an appropiately sized square-grid pattern, as recommended by the San Diego County Hydrology Manual (San Diego County 2003). The mean channel slope (for time-of-concentration calculations and channel routing) was measured from topographic maps. For subbasins greater than 16 km2, the catchment lag is taken as 60% of the time of concentration (USDA SCS 1972). The results of the Campo-Tecate subbasin hydrologic characteristics are shown in Figure 9. The total basin drainage area is 42082.1 ha, or 420.821 km2. The aerial-weighted runoff curve number (AMC II) is CN = 70.
The stream-channel routing component of the modeling was performed with the Muskingum-Cunge method (Ponce 1989). The channel reaches (Example: Tecate Creek, reach 30106) were divided into a suitable number of subreaches, depending on the cross-sectional variability. Representative cross sections were measured in the field, and fed to the computer model (Figure 10). With mean channel slope (Figure 9), estimates of Manning's n for center channel, left overbank, and right overbank, and the pertinent cross-sectional data, the model computed the rating curves on which to base the calculation of the routing parameters (Ponce 1989). The Muskingum-Cunge method requires that the Courant number, defined as the ratio of physical celerity (the kinematic, or "Seddon," celerity) to numerical celerity (the ratio of space step Δx to time step Δt), be kept as close to 1 as practicable. This is for the purpose of assuring good stability and convergence properties (Cunge 1969). Accordingly, the RAINFLO model was run judiciously to satisfy the Courant constraint. Mirror cross sections were added as required to increase the Courant number to values close to 1. The channel transmission losses are modeled by specifying a reach (or subreach) average infiltration velocity. This value is a composite value of center channel, left overbank, and right overbank. The infiltration velocity is used, together with the C3 Muskingum-Cunge routing coefficient, to produce a channel routing calculation where the deterministic effects of source/sinks (lateral inflow/outflow) are appropriately taken into account (Ponce 1986).
Barring distributed data on infiltration velocities, a value of 2
|
5. RESULTS
[Conclusions]
[References]
•
[Introduction]
[Background]
[Methodology]
[Data Collection]
The Tecate Creek rehabilitation project reach is reach No. 16 in the basin topology, labeled Arroyo Tecate 1, which drains locally
reach subbasin 30106 (Figure 6).
Accordingly, the results of computer simulations are expressed at two points:
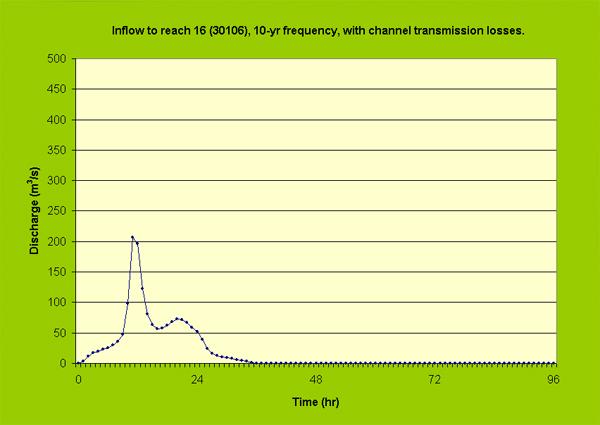
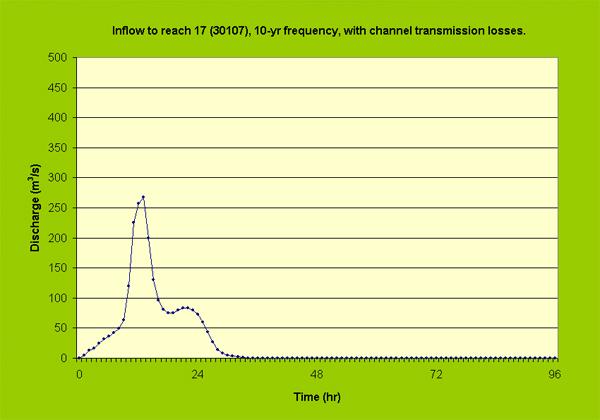
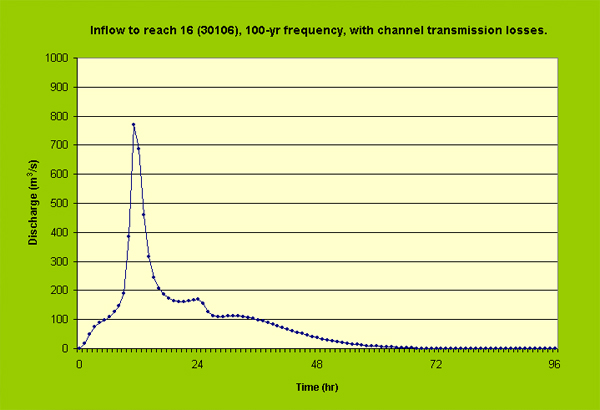
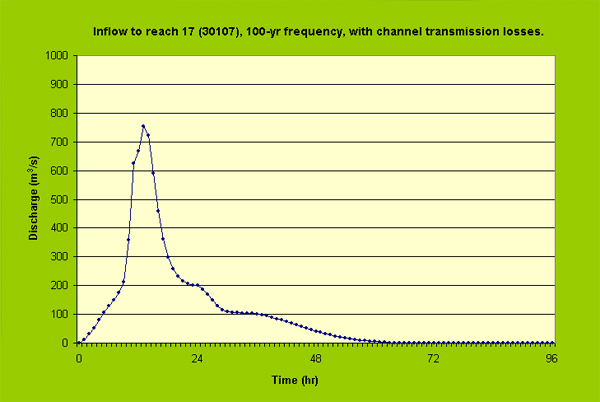
The computer simulations were performed for return periods of 2, 5, 10, 25, 50, and 100 years. For the return periods of 2 to 25 years, the antecedent moisture condition was set at average, i.e. AMC II. For the return periods of 50 and 100 years, the antecedent moisture condition was set at wet, i.e. AMC III, applicable to Eastern San Diego County (mountains) (Ponce 1989). This practice is recommended by the San Diego County Hydrology Manual (San Diego County 2003). A summary of the results of the computer simulation is shown in Table 1. Figures 11 and 12 show the 10-yr frequency flood hydrographs calculated upstream of reach Nos. 16 and 17, respectively. Figures 13 and 14 show the 100-yr frequency flood hydrographs calculated upstream of reach Nos. 16 and 17, respectively. A complete set of simulated flood hydrographs, with and without channel transmission losses, for flood frequencies of 2, 5, 10, 25, 50, and 100 yr is given by Ponce (2005b).
From the data of Figure 9, an aerial-weighted average (AMC II) runoff curve number for the entire Campo-Tecate Creek
watershed/basin is calculated as CN = 70. The corresponding wet (AMC III) curve number, applicable to floods with return periods of 50 and 100 yr is CN = 85
(Ponce 1989).
This explains the substantial difference between the results of this study and those of the Rhoda Arkhos study.
In the latter study, the adopted curve
number was CN = 50 for the entire basin, which led to a 100-yr flood peak discharge of
Q100 = 169
For completeness, the extension of the results of Table 1 to longer return periods, up to the 10,000-yr flood is warranted.
This can be accomplished using the Gumbel extreme-value probability function (Ponce 1989).
For this purpose, the peak discharge Q is the set of modeled peak discharges corresponding to 2, 5, 10, 25, 50, and 100-yr return periods (Table 1).
For each return period, the Gumbel variate y was calculated, and a straight line fitted to the Q-y data set. The equation of the line is:
Table 2 shows the complete set of peak discharges for Tecate Creek, from 2-yr to 10,000-yr return period.
| |||||||||||||||||||||||||||||||||||||||||||||||||||||||||||||||||||||
6. CONCLUSIONS
[References]
•
[Introduction]
[Background]
[Methodology]
[Data Collection]
[Results]
A flood hydrology study has been performed for Tecate Creek at Tecate, in northern Baja California, Mexico. The contributing drainage
basin straddles the U.S.-Mexican border, with its headwaters in Eastern San Diego County, California (Figure 6). About 60% of the basin lies
in the United States.
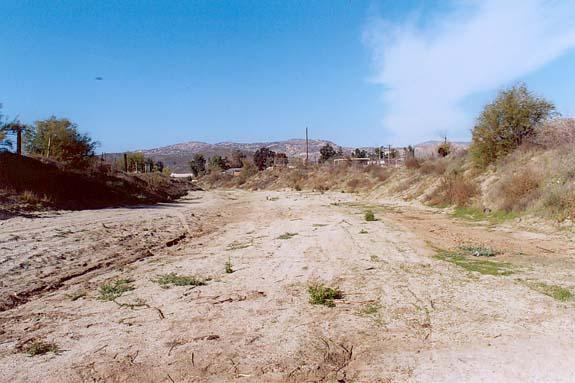
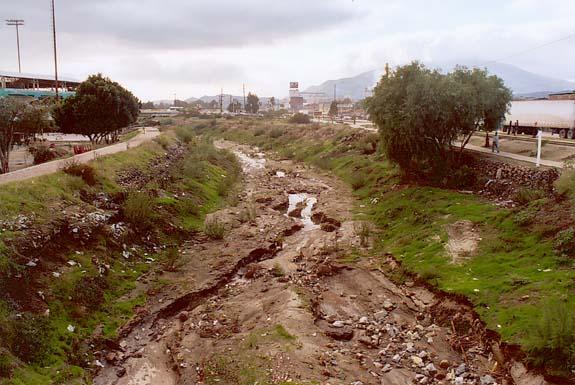
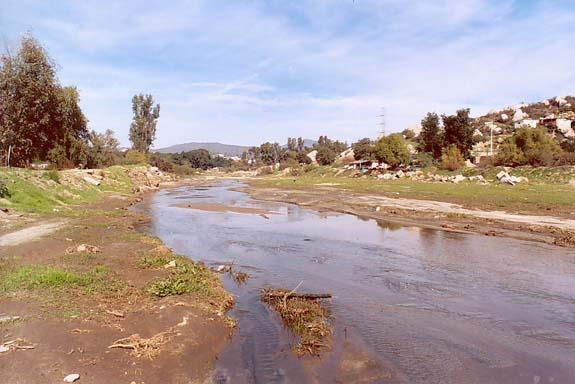
The study is needed to establish flood peak discharges on which to base the proposed rehabilitation of Tecate Creek (Arroyo Tecate) (Figure 15).
The rehabilitation project encompasses a 11.5-km reach, from its upstream point at Puente San Jose II,
to its downstream point at Puente La Puerta (Figure 2).
A distributed conceptual-deterministic event-driven rainfall-runoff model was used to perform the study.
Hydrologic and other relevant data were measured or estimated for twentysix subbasins (26), with a total drainage area of 420.821
km2 (Figure 9). For reference purposes,
an aerial-weighted runoff curve number (AMC II) was calculated at CN = 70. This corresponds to CN = 85 for AMC III. It is noted that
these values are much higher
than those estimated in previous studies.
Flood peak discharges were calculated for return
periods ranging from 2 yr to 100 yr. The peak discharge set was extended to the 10,000-yr return period using the Gumbel method.
The complete results are summarized in Table 2.
The 10-yr flood peak, i.e., the regulatory flood, is
Q10 = 268
|
|
| Figure 15. Tecate Creek near El Descanso, Tecate, showing extent of channel degradation. |
7. REFERENCES
•
[Introduction]
[Background]
[Methodology]
[Data Collection]
[Results]
[Conclusions]
California State Polytechnic University Studio 606. 2003. A framework for an urban river environment: Tecate, Mexico.
Centro de Estudios Sociales y Sustentables. 2004. Programa parcial de mejoramiento de la zona Río Tecate. Tijuana, Baja California, Mexico.
Chow, V. T. 1959. Open-channel hydraulics. McGraw-Hill, New York.
Cunge, J. A. 1969. "On the subject of a flood propagation computation method (Muskingum method)."
Journal of Hydraulic Research, 7(2): 205-230. http://ponce.sdsu.edu/cunge205.html
HEC-HMS. 2004. Technical Reference Manual. U.S. Army Corps of Engineers, Hydrologic Engineering Center, Davis, California.
NOAA National Weather Service. 1973. Atlas 2: Precipitation Atlas of the Western United States. Washington, D.C.
Ponce, V. M., and D. B. Simons. 1977. "Shallow wave propagation in open channel flow." ASCE Journal of the Hydraulics Division, 103(HY12): 1461-1476.
http://ponce.sdsu.edu/shallowwave1461.html
Ponce, V. M. 1978. "Muskingum-Cunge method with variable parameters." ASCE Journal of the Hydraulics Division, 104(HY12): 1663-1667.
http://ponce.sdsu.edu/variableparameters1663.html
Ponce, V. M. 1986. "Diffusion wave modeling of catchment dynamics." ASCE Journal of Hydraulic Engineering, 112(8): 1663-1667.
http://ponce.sdsu.edu/diffusionwave716.html
Ponce, V. M. 1989. Engineering Hydrology, Principles and Practices. Prentice-Hall, Englewood Cliffs, New Jersey.
http://ponce.sdsu.edu/330textbook_hydrology_chapters.html
Ponce, V. M. 1996. "Runoff curve number: Has it reached maturity?" ASCE Journal of Hydrologic Engineering, 1(1): 11-19.
http://ponce.sdsu.edu/runoff11.html
Ponce, V. M. 2001. "Flood hydrology of the Binational Cottonwood Creek - Arroyo Alamar, California and Baja California."
Online report, Version 1.05 (050509), (cited 14 July 2005).
http://alamar.sdsu.edu/alamar/alamarenglish.html
Ponce, V. M. 2005a. "Tecate Creek restoration subbasin delineation: Map album (view)" Online documentation (cited 14 July 2005).
http://ponce.sdsu.edu/tecate_creek_restoration_subbasin_delineation_3.html
Ponce, V. M. 2005b. "Tecate Creek restoration flood hydrographs." Online documentation (cited 14 July 2005).
http://ponce.sdsu.edu/tecate_creek_restoration_flood_hydrographs.html
Rhoda Arkhos Ingeniería S.C. Estudio hidrólogico del Río Tecate.
San Diego County, California. 2003. Hydrology Manual. Electronic version, September.
USDA Soil Conservation Service. 1972. SCS National Engineering Handbook, Section 4, Hydrology (NEH-4). Washington, D.C.
USDA Soil Conservation Service. 1983. "Channel transmission losses." Chapter 19 in National Engineering Handbook, Section 4, Hydrology (NEH-4).
Washington, D.C.
|
|
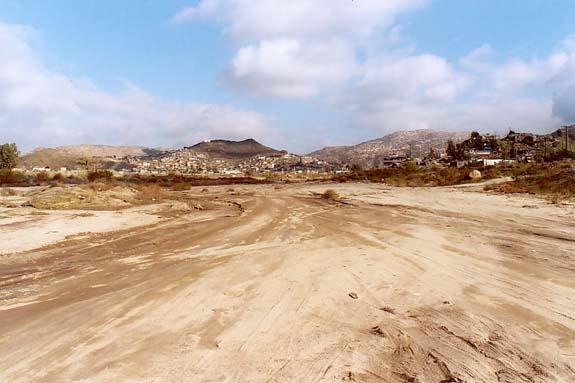
| Fig. 16 Tecate Creek, in Tecate, Baja California, Mexico (km 8+800). |
| http://ponce.sdsu.edu/tecate_creek_flood_hydrology_report.html | 050715 |