 |
|
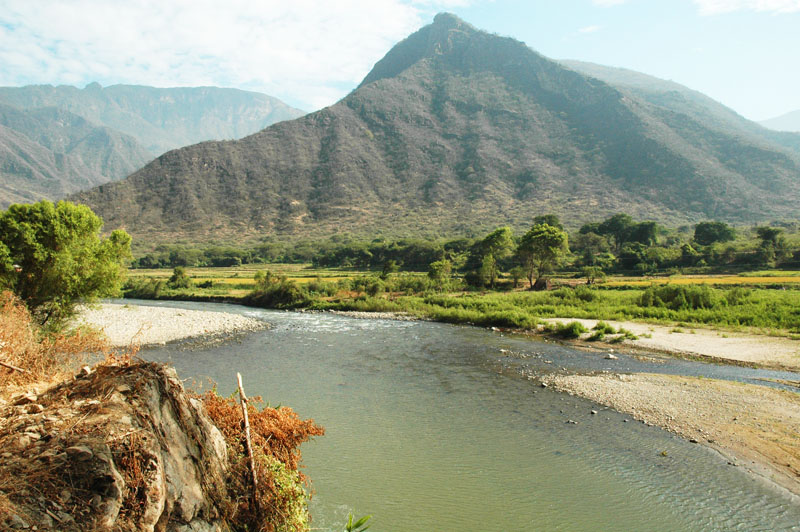
Fig. 1 Proposed damsite at |
LAMBAYEQUE, PERU
TASK 5: ENVIRONMENTAL IMPACT ASSESSMENT
PART 3: SECTION 4
July 24, 2009
Dr. Victor M. Ponce
Environmental Consultant
4. PHYSICAL SETTING
The physical setting includes a description of the geography, geology, geomorphology, hydrology, archaeology,
and environmental quality in the project area and vicinity.
4.1 Geography
The project site is located within the La Leche river basin, in the departments of Lambayeque and Cajamarca, along
the western slopes of the Western Range of the Peruvian Andes.
The La Leche river is formed at the confluence of the Moyán and Sangana rivers,
at 06o 22' 20" S and 79o 27' 22" W (Fig. 8: Red arrow).
Once formed, the La Leche river flows in a predominantly western direction until it joins the Motupe river
at coordinates 06o 26' 10" S and 79o 55' 02" W (Fig. 8: Blue arrow).
Downstream of the confluence, the Motupe river flows in a general western direction, eventually
discharging into the La Niña Lake, without an outlet to the sea.
The towns of Jayanca, Pacora, and Íllimo are located in the La Leche river valley.
The towns of Túcume, Mochumí and Pítipo are located in the flood plain
shared by both La Leche river and its neighboring Chancay river to the south.
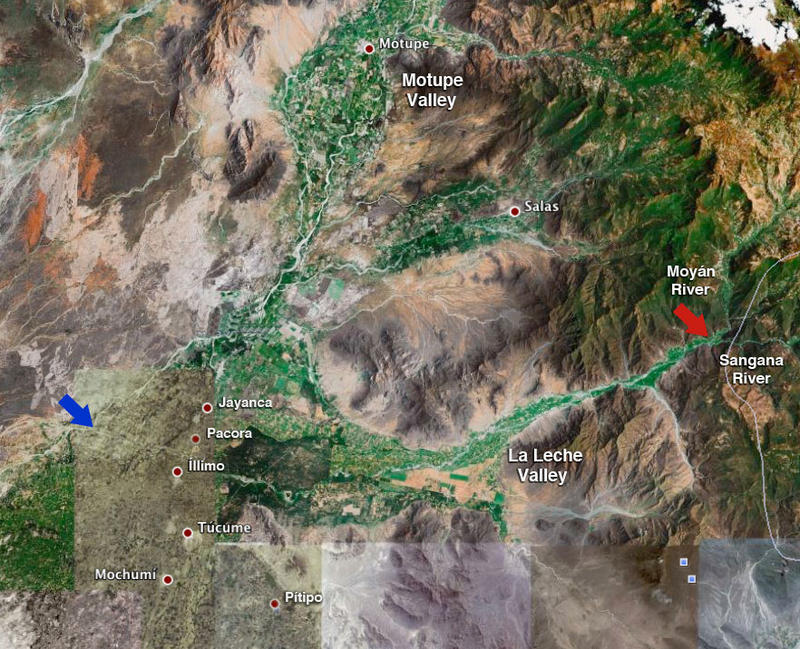 |
| Fig. 8 Satellite image of the La Leche river between upstream end (read arrow) and downstream end (blue arrow) (Source: Google Earth). |
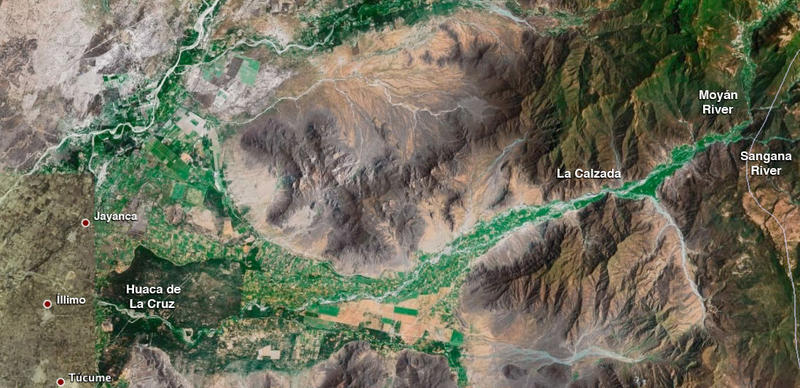
The La Leche river has three distinct reaches:
- Upper reach, from the confluence of the Moyán and Sangana rivers to the natural geologic constriction at La Calzada, at coordinates 06o 24' 04" S and 79o 31' 33" W (Fig. 9);
- Middle reach, from La Calzada to Huaca de la Cruz, at coordinates 06o 28' 27" S and 79o 48' 20" W (Fig. 9); and
- Lower reach, from Huaca de la Cruz to the confluence with the Motupe river.
 |
|
Fig. 9 Satellite image of the upper and middle La Leche river valley (Source: Google Earth). |
The hamlets (or towns) in the La Leche river valley, in its upper and middle reaches, listed from upstream to downstream, are the following:
On the left margin: El Algarrobo, La "U", Mochumí Viejo, Mayascón, La Traposa, Papayo Desaguadero, Motupillo, Jayanquillo, Patapón, Batán Grande, Tambo Real, La Saranda, and Noria Las Salinas.
On the right margin: Limón, Puchaca, La Calera, Calicantro, San Juan, Magdalena, Manchurria, Magdalena Papayal, Tres Puentes, Pativilca, Santa Clara, Pan de Azúcar, El Verde, Ojo de Toro, and Noria Poma.
The hills adjoining the La Leche river valley, in its upper and middle reaches, listed from upstream to downstream, are the following:
On the left margin: Pampa de la Mula, Carampón, La "U", Calabozo, La Traposa, Motupillo, and Patapón.
On the right margin: Lajas, Negrahuasi, La Calera, Huaca Rajada, Calicantro, Hualtaco (so named herein), Pan de Azúcar, and Pelado.
4.2 Geology
The stratigraphy of the La Leche river valley in its upper and middle reaches
has been thoroughly documented by Pardo and Sanz (1979).
The outcrops, measured on the left margin, from Motupillo to Limón, consist of
metamorphic and sedimentary rocks dating to the Precambrian-Paleozoic eras, and Triassic, Jurassic, and
Cretaceous periods, which form part of the flank of a faulted dome structure.
Intruding dacitic rocks (similar to andesite), in the form of sills and dikes, are found in part of the area.
Four groups or formations of sedimentary rocks
rest on top of a Precambrian craton of gray phyllites (old metamorphic rocks).
The oldest is the Mitu group, with a thickness of 192 m, consisting of Upper Paleozoic
conglomerates, sandstones, and fanglomerates of purple gray color and continental facies.
On top of the Mitu Group is the Pucará Group, with a thickness of 1,240 m,
and is represented by Upper Triassic and Lower Jurassic carbonate sediments.
In the Triassic, regressive marine sedimentation culminated in dolomitic coral reefs;
in the Jurassic, transgressive marine sedimentation culminated in distal turbiditic limestones.
On top of the Pucará Group, the Colán formation, with a thickness 434 m,
is represented by continental volcanoclastic sediments.
On top of the Colán formation is the Chimú formation, represented by quartz sandtones.
The Upper Triassic La Calzada member outcrops at La Calzada,
along the northernmost flank of Cerro Calabozo (Fig. 10). The rocks have a total thickness of
171 m, and consist of three types:
In neighboring Mochumi Viejo, at the reservoir site,
the outcrops consist of 118 m of
light-color calcarenitic limestones.
These limestones alternate rythmically with thin-bedded siliceous micritic limestones of greenish color in the lower part,
to purple and violet color in the upper part.
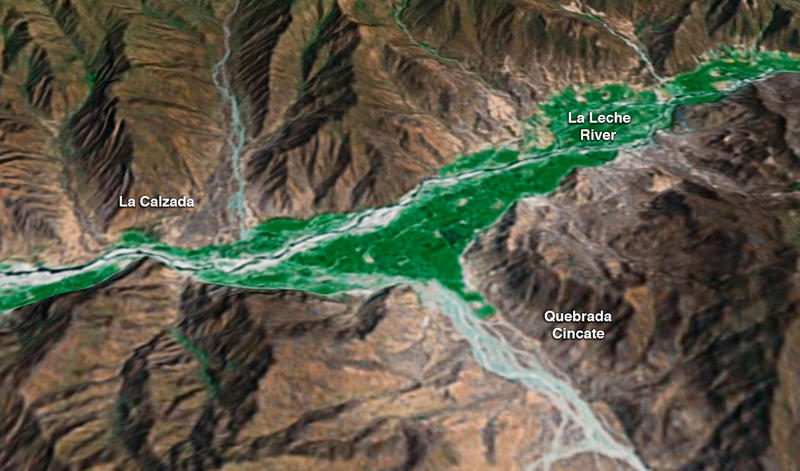
The Colán formation, with a maximum thickness of 358 m,
outcrops along Cincate Creek [Quebrada Cincate].
It contains sandstones and quasi-brecciated
conglomerates, which are arkosic and of purple color, and tufaceous graywackes, alternating with
greenish chert (Pardo and Sanz, 1979).
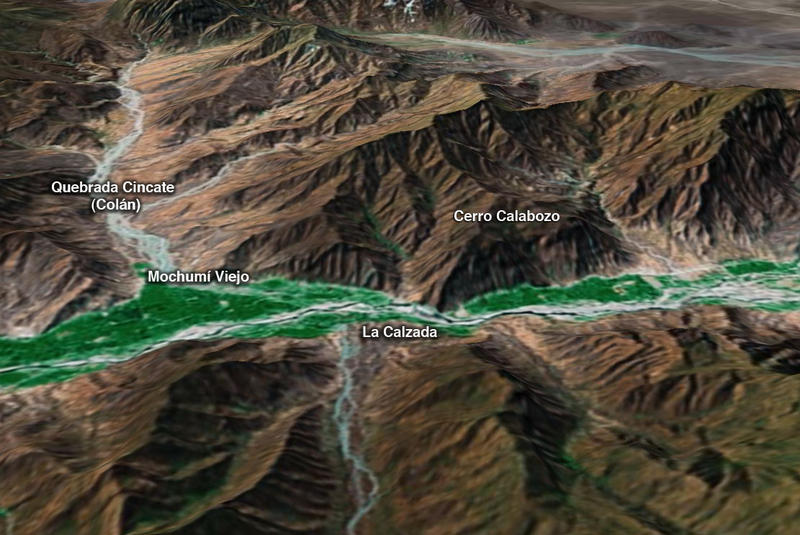 |
| Fig. 10 View to the South of Cerro Calabozo (Source: Google Earth). |
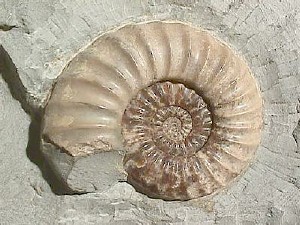
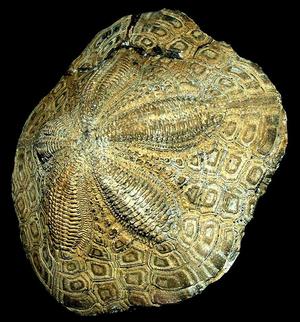
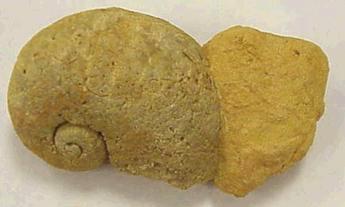
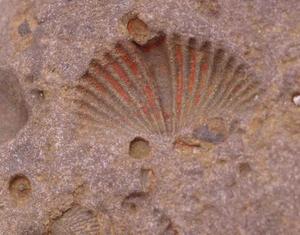
Fossils are widely disseminated in the project area and vicinity. The fossil ages range from the Upper Paleozoic (300 to 250 Ma) to the Triassic-Jurassic periods (250 to 150 Ma). The petrified specimens are generally made of calcite (calcium carbonate) of gray color, and feature marine invertebrates such as ammonites, echinoderms, gastropods, molluscs, and oysters (Fig. 11).
|
| ||
|
|
|
Fig. 11 Fossils of (a) ammonite, (b) echinoderm, (c) gastropod, and (d) mollusc. (Source: Google). |
Specimens of fossilized flora such as Otozamites cf. klipsteini DKR and Weichselia peruviana ZEILLER have been found between La "U" and Cerro Lajas de Tongón, near the confluence of the Moyan and Sangana rivers. These fossils have been dated to the neocomian stage (Lower Cretaceous period) (144-125 Ma) (Pardo and Sanz, 1979).
The fossil record points to rocks deposited in a hypabyssal marine environment. The outcrops are presently covered with alluvial sediments. Fossils containing calcium carbonate are susceptible to dissolution in water, regardless of their age. However, the rate of dissolution may be slow compared to the lifetime of the dam.
4.3 Geomorphology
The study region features steep
mountain ranges rising from sea level to
more than 4,000 m within a distance of barely 100 km. The mountains are very steep, with slopes averaging more than 30%,
and are extensively dissected, forming dendritic exorheic drainages which perennially feed the mainstem rivers.
In turn, the streams
have steep slopes, often exceeding 10%, a situation which contributes to floods of devastating force.
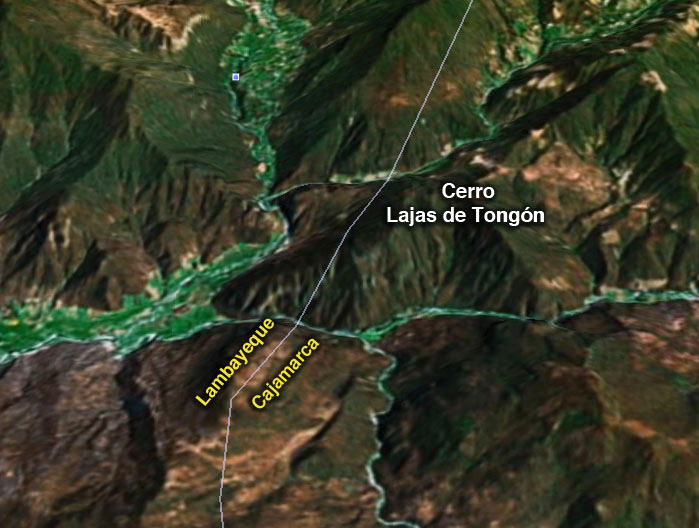
The relief can be nearly vertical in places,
as shown by the Cerro Lajas de Tongón, which
straddles the geographical boundary between Lambayeque and Cajamarca, immediately east
of the confluence of the Moyán and Sangana rivers (Fig. 12). The swiftness of the currents, particularly during floods,
results in the entrainment and transport of large quantities of sediment, both alluvial and colluvial in origin.
 |
|
Fig. 12 Panoramic view of Cerro Lajas de Tongón (Source: Google Earth). |
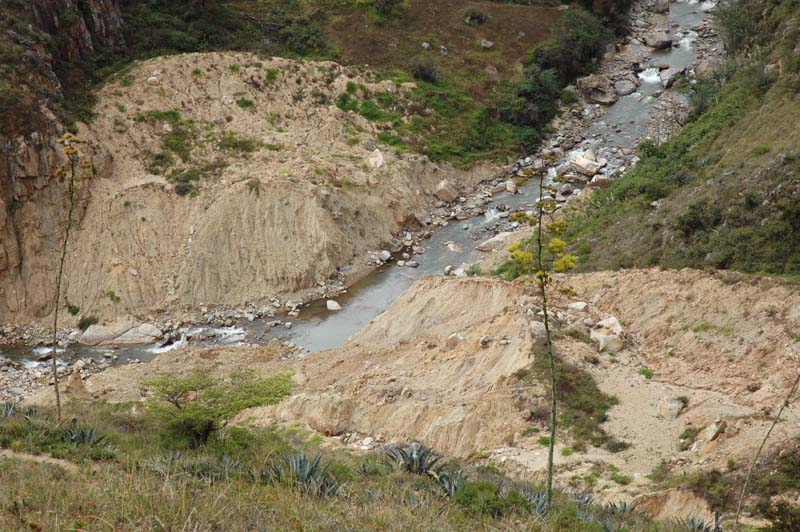
A significant source of sediment in the upper basin originates in landslides, known locally as "huaycos." One such landslide has deposited large amounts of sediment onto the Moyán river. As shown in Fig. 13, to this date the stream is still working on the soil and rock deposit, as floods continue to entrain more of the slide volume and transport it downstream.
 |
|
Fig. 13
Landslide that has reached the Moyán river, near Tingo (photo taken June 10, 2008). |
The existence of the broad valley upstream of La Calzada, where a reservoir is planned, is attributed to forced sedimentation due to
the following flow processes:
In particular, a difference in the relative magnitude of floods between La Leche river and Cincate Creek (at their confluence) would lead to
backwater in the stream with the smaller flood and, consequently, to sediment deposition.
In the recent geologic past (2 Ma), this mechanism may have been responsible for the deposition of large quantities of sediment
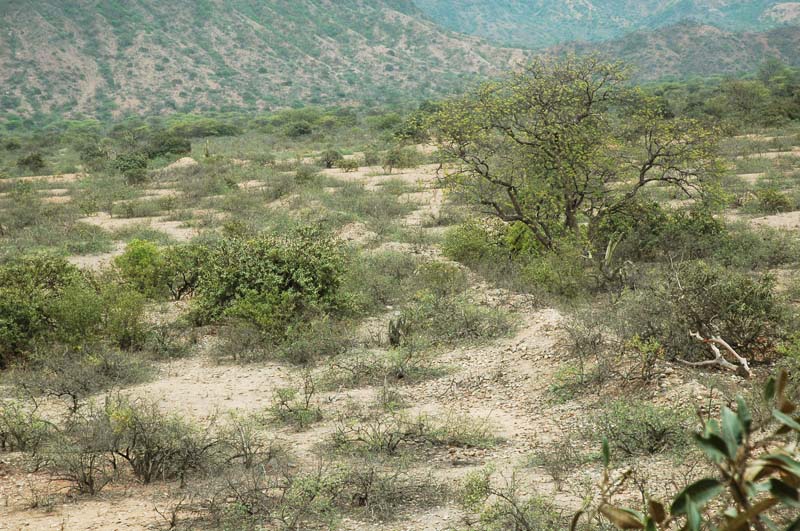
to form the broad valley located upstream of La Calzada (Fig. 14).
The geomorphological evidence suggests the entrainment and transport of large quantities of sediment, in both La Leche river and Cincate Creek.
 |
|
Fig. 14 Panoramic view of reservoir site upstream of La Calzada (Source: Google Earth). |
4.4 Hydrology
The La Leche river has its headwaters at Cerro Choicopico, about 6 km east of (the town of) Incahuasi,
at an elevation of 4,230 m above mean sea level (Fig. 15).
The La Leche river at La Calzada has three major tributaries:
The drainage area of the La Leche river to La Calzada is 907 km2.
The hydraulic length from headwaters to La Calzada, along the course of the Moyán is 44,397 m, and along the Sangana is 44,591 m.
Mean velocities during infrequent flood events average 4 m/s. The time of concentration is about 3 hr (Ponce, 2008).
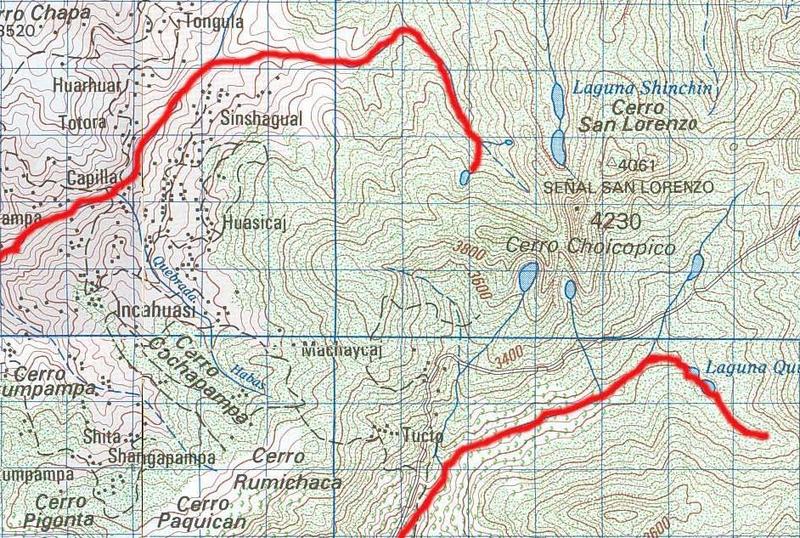 |
| Fig. 15 Map of Cerro Choicopico (center right) and the town of Incahuasi (center left), showing in red color the headwater reaches of the Moyán and Sangana rivers (top left and bottom right, respectively). |
The design flood discharges for a dam at La Calzada have been evaluated by Ponce (2008). The principal spillway hydrograph is based on the 100-yr flood, and the freeboard hydrograph is based on the Probable Maximum Precipitation (PMP), or 10,000-yr flood. Table 1 shows the flood peak discharge, runoff volume, area-weighted 24-hr storm depth, rainfall volume, and runoff percentage (ratio of runoff volume to rainfall volume).
| Table 1. Design flood discharges for dam at La Calzada. | |||||
| Hydrograph | Flood peak discharge (m3/s) |
Runoff volume (hm3) |
Area-weighted 24-hr storm depth (mm) |
Rainfall volume (hm3) |
Runoff (%) |
| Principal spillway hydrograph | 3,608 | 86.6 | 121 | 109.8 | 0.79 |
| Emergency spillway hydrograph | 4,244 | 107.4 | 145 | 131.6 | 0.82 |
| Freeboard hydrograph | 6,147 | 166.5 | 213 | 193.3 | 0.86 |
The Moyán river accounts for 27.3% of the flood volume, the Sangana river for 43.6%, and Cincate Creek for 16.6%. The remaining flood volume (12.5%) is accounted for by local contributions (Ponce, 2008).
The La Leche river is measured at the hydrometeorological station at Puchaca, about 4 km upstream of La Calzada (Fig. 16).
The record length is about 50 years.
The maximum recorded discharge at Puchaca is 580 m3/s. The mean annual runoff at Puchaca is 5 m3/s.
The Puchaca station may have to be moved if backwater from the dam at La Calzada renders the rating inoperable.
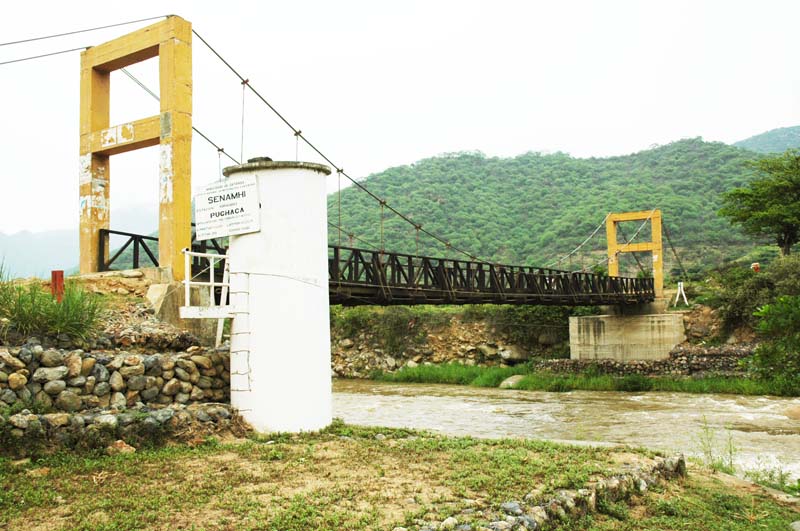 |
| Fig. 16 Hydrometeorological station: La Leche river at Puchaca. |
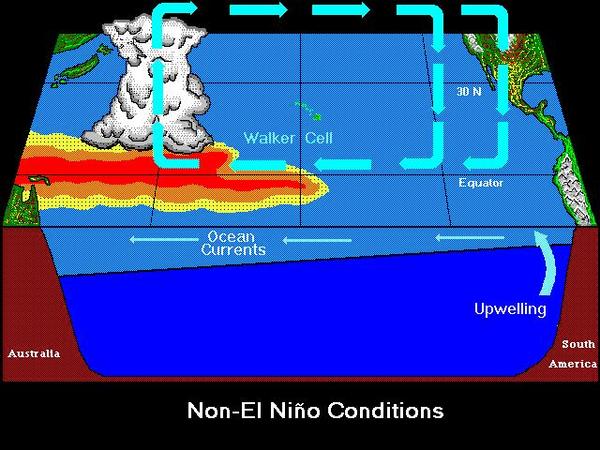
The La Leche river floods are subject to El Niño,
a meteorological event of mesoscale size, which temporarily changes the precipitation patterns in the region.
El Niño is a climatic anomaly caused by a weakening of the trade winds along the tropical Pacific,
which leads to warmer-than-normal sea-surface waters along the eastern tropical Pacific (Fig. 17).
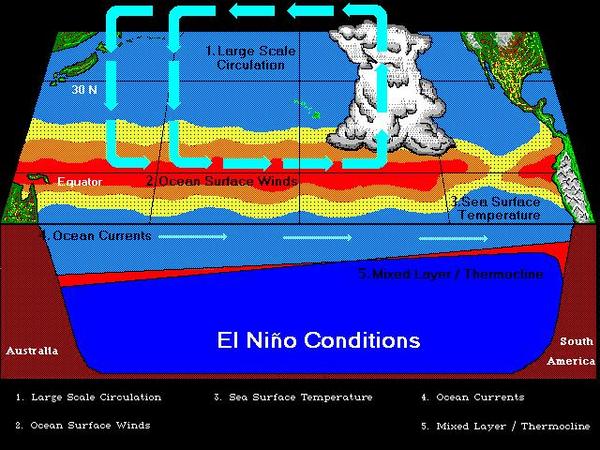
Strong El Niño events recur every 8 to 15 years, and bring substantial, and sometimes extreme, amounts of moisture
to the region, particularly to the near-coastal areas, which are naturally prone to flooding due to their lack of soil cover (Ponce and Shetty, 2008).
Mitigation against the recurrent ravages of El Niño is one of main objectives of the present project.
 |
|
Fig. 17 (a) Non-El Niño conditions along the tropical Pacific Ocean (Source: University of California Santa Barbara). |
 |
|
Fig. 17 (b) El Niño conditions along the tropical Pacific Ocean (Source: University of California Santa Barbara). |
Calicantro dam is located in Rinconada Calicantro, which drains Hualtacal Creek, with headwaters at Cerro San Antonio and
Cerro Carpintero. Hualtacal Creek is an ephemeral braided creek, which indicates a substantial amount of sediment transport during floods.
The drainage area is 29.4 km2 (Fig. 18).
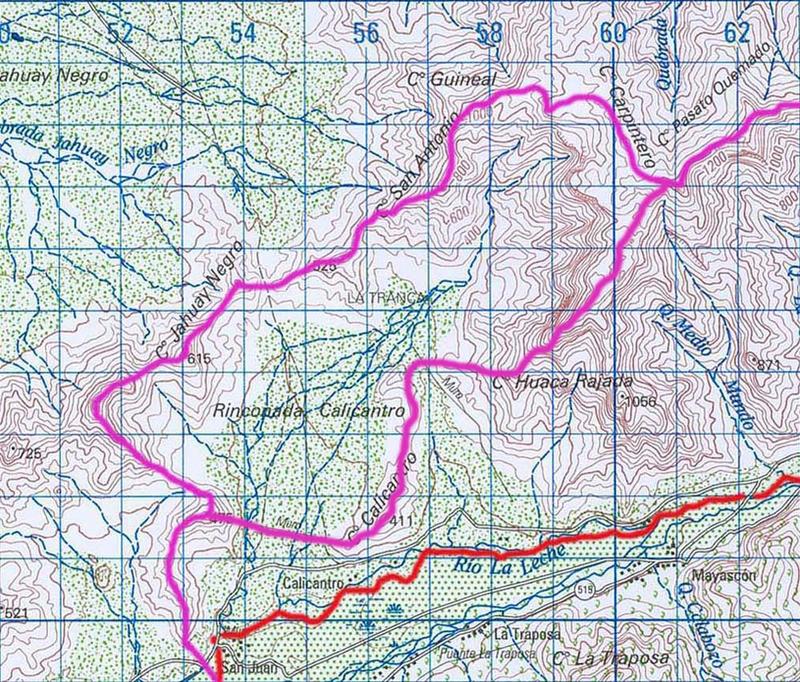 |
| Fig. 18 Drainage basin of Calicantro dam (drainage area enclosed in purple). |
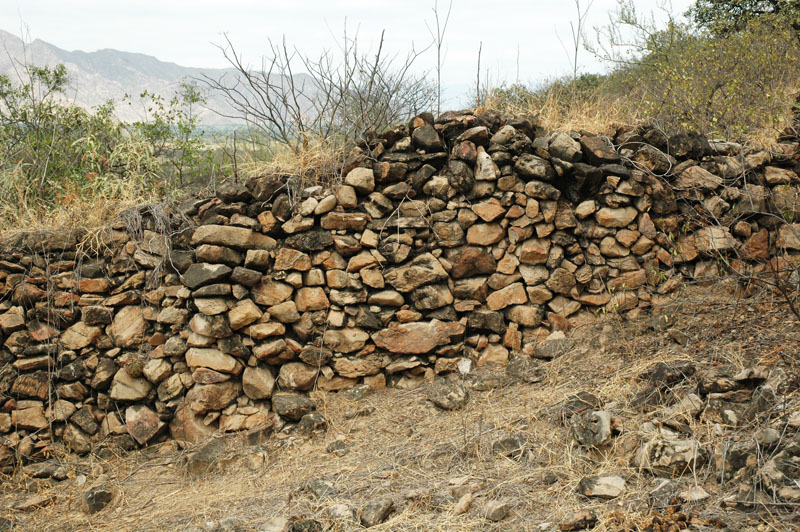
The dam axis follows approximately the alignment of an ancient anthropogenic feature, presumed to be a
defensive wall, which cuts across the valley at the narrowest point of the lower end (Fig. 19). The wall would be flooded by the planned reservoir.
 |
| Fig. 19 Ancient mud-brick wall at narrowest point of the lower end of Rinconada Calicantro. |
The design flood discharges for a dam at Calicantro have been evaluated by Ponce (2008a). The principal spillway hydrograph is based on the 100-yr flood,
and
the freeboard hydrograph is based on the Probable Maximum Precipitation (PMP), or 10,000-yr flood.
Table 2 shows the flood peak discharge, runoff volume, area-weighted 24-hr storm depth, rainfall volume, and runoff percentage (ratio of runoff volume to rainfall
volume).
| Table 2. Design flood discharges for dam at Calicantro. | |||||
| Hydrograph | Flood peak discharge (m3/s) |
Runoff volume (hm3) |
Area-weighted 24-hr storm depth (mm) |
Rainfall volume (hm3) |
Runoff (%) |
| Principal spillway hydrograph | 294 | 5.33 | 203 | 5.96 | 0.89 |
| Emergency spillway hydrograph | 370 | 6.81 | 253 | 7.43 | 0.92 |
| Freeboard hydrograph | 516 | 11.03 | 397 | 11.66 | 0.95 |
The La Leche river basin has been occupied with human settlement through millennia.
However, there are no readily identified archaeological remains in the upper reach of the
La Leche river, from confluence (of Moyán and Sangana) to La Calzada.
In contrast, the middle reach has archaeological remains, some of considerable importance.
Rinconada Calicantro features a mud-brick wall, described in Section 4.4, which spans the valley on its narrowest lower end (Fig. 19).
The age of this wall has not been determined; it is presumed to be at least 500 years old.
The wall appears to continue on the Hualtaco hill which delimits Rinconada Calcantro to the West (Fig. 20).
4.5 Archaeology
 |
| Fig. 20 Masonry wall on Cerro Hualtaco. |
The most important archaeological site (or sites) in the project area is the series of adobe pyramids near and within the Pomac Forest, collectively named the "Historic Sanctuary of the Pomac Forest." The sanctuary is located on the lower middle course of the La Leche river, near Huaca de La Cruz, at a mean elevation of 80 m above mean sea level. It occupies an area of 5,887 ha in the province of Ferreñafe, department of Lambayeque (Fig. 21).
The sanctuary includes several ancient ceremonial sites, of rich archaeological value. These sites have been traced to the Sicán culture,
which inhabited the area starting in 750 A.D., and reached its maximum splendor in the period 900-1100 A.D.
The edifications, known locally as "huacas," comprise more than twenty (20) pyramids of adobe and mud, covering
an area of 45 km2.
Notably among the huacas are Botija, Colorada, Ingenieros, Loro (El Oro), Merced, Sontillo, Abejas, Ventanas, Rodillona, and El Mirador.
In addition to their ceremonial purpose,
the huacas may have been used by the early inhabitants of the La Leche valley
as a means to secure temporary protection against the recurrent floods.
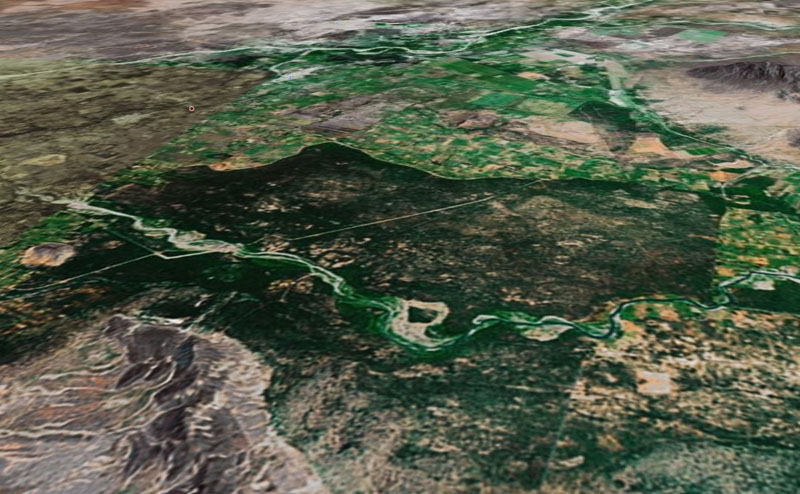 |
| Fig. 21 Aerial perspective of the Pomac Forest (Source: Google Earth). |
The archaeological remains of Pomac and vicinity are located far enough downstream of the area of physical influence of the planned dams; therefore, they will not be directly affected by the project. However, the Pomac Forest is a floodplain forest; therefore, groundwater levels should be monitored carefully to ensure that upstream dam operation does not appreciably affect the normal (or historic) water table levels in the flood plain.
4.6 Environmental Quality
Environmental quality throughout the La Leche basin prior to project execution is considered to be good.
The cognizant monitoring agency is the General Directorate of Health (DIGESA), of the Ministry of Health of Peru.
DIGESA classifies the La Leche river as a Class III watercourse,
i.e., one suitable for potable use, with prior treatment,
and also for agricultural use.
The results of three measurements of heavy metals, shown in Table 3, indicate compliance with existing laws (Gobierno del Perú, 1969a; 1969b),
denoting generally good water quality with regard to toxic substances.
With reference to wastewater criteria,
the law requires for Class III streams a minimum dissolved oxygen (DO) concentration of 5 mg/L, at any temperature and pressure; and
a maximum 5-day biochemical oxygen demand (BOD5) of 25 mg/L at 20oC in any day.
No measurements of dissolved oxygen (DO) or biochemical oxygen demand (BOD) were identified in the project area.
| Table 3. Measurements of heavy metals in the La Leche river. | ||||||||
| Location | Temp. (oC) |
Cd (mg/L) |
Cu (mg/L) |
Cr (mg/L) |
Fe (mg/L) |
Mn (mg/L) |
Pb (mg/L) |
Zn (mg/L) |
| Class III stream, maximum value | - | 0.05 | 1.5 | 0.05 | - | - | 0.1 | 15 |
| 1. La Traposa | 22.2 | <0.01 | 0.134 | <0.028 | 2.119 | 0.073 | <0.025 | 0.017 |
| 2. Bridge over Sangana river | 23.5 | <0.01 | 0.133 | <0.028 | 2.242 | 0.073 | <0.025 | <0.011 |
| 3. Moyán (behind Health Center) | 18.0 | <0.01 | 0.138 | <0.028 | 2.318 | 0.056 | <0.025 | <0.011 |
| Source: Ministerio de Salud, DIGESA: January 24, 2008. |
In Peru, environmental quality with regard to air is regulated by the "Regulation Law of National Standards for Environmental Quality of Air" (Gobierno del Perú, 2001). The standards regulate the air quantities of the following contaminants:
- Sulphur dioxide (SO2),
- Particulate material, with diameter less than or equal to 10 μm (PM-10),
- Carbon monoxide (CO),
- Nitrogen dioxide (NO2),
- Ozone (O3),
- Lead (Pb), and
- Hydrogen sulphide (H2S).
The national standards for air quality are shown in Table 4. No measurements were identified for air pollution. Baseline air quality levels in the project area are considered to be good.
| Table 4. National standards for environmental quality of air. | ||||||||
| Contaminant | Standard | |||||||
| Time period |
Value (μgr/m3) |
Format | ||||||
| Sulphur dioxide (SO2) | annual | 80 | Arithmetic mean | |||||
| 24 hr | 365 | Not to exceed more than 1 event/yr | ||||||
| Particulate material (PM-10) | annual | 50 | Arithmetic mean | |||||
| 24 hr | 150 | Not to exceed more than 3 events/yr | ||||||
| Carbon monoxide (CO) | 8 hr | 10,000 | Movable mean | |||||
| 1 hr | 30,000 | Not to exceed more than 1 event/yr | ||||||
| Nitrogen dioxide (NO2) | annual | 100 | Arithmetic mean | |||||
| 1 hr | 200 | Not to exceed more than 24 events/yr | ||||||
| Ozone (O3) | 8 hr | 120 | Not to exceed more than 24 events/yr | |||||
| Lead (Pb) | annual | To be determined | ||||||
| monthly | 1.5 | Not to exceed more than 4 events/yr | ||||||
| Hydrogen sulphide (H2S) | 24 hr | To be determined | ||||||
| Source: Regulation Law of National Standards for Environmental Quality of Air (Peru). |
In Peru, environmental quality with regard to noise is regulated by the "Regulation Law of National Standards for Environmental Quality for Noise" (Gobierno del Perú, 2003). The applicable national standards for noise are shown in Table 5. No measurements were identified for noise pollution. Baseline noise levels in the project area are considered to be acceptable.
| Table 5. National standards for environmental quality for noise. | ||||||||
| Zone | Noise level (dbA) | |||||||
| Diurnal (7:00-22:00) |
Nocturnal (22:00-07:00) |
|||||||
| Special protection | 50 | 40 | ||||||
| Residential | 60 | 50 | ||||||
| Commercial | 70 | 60 | ||||||
| Industrial | 80 | 70 | ||||||
| Source: Regulation Law of National Standards for Environmental Quality for Noise (Peru). |